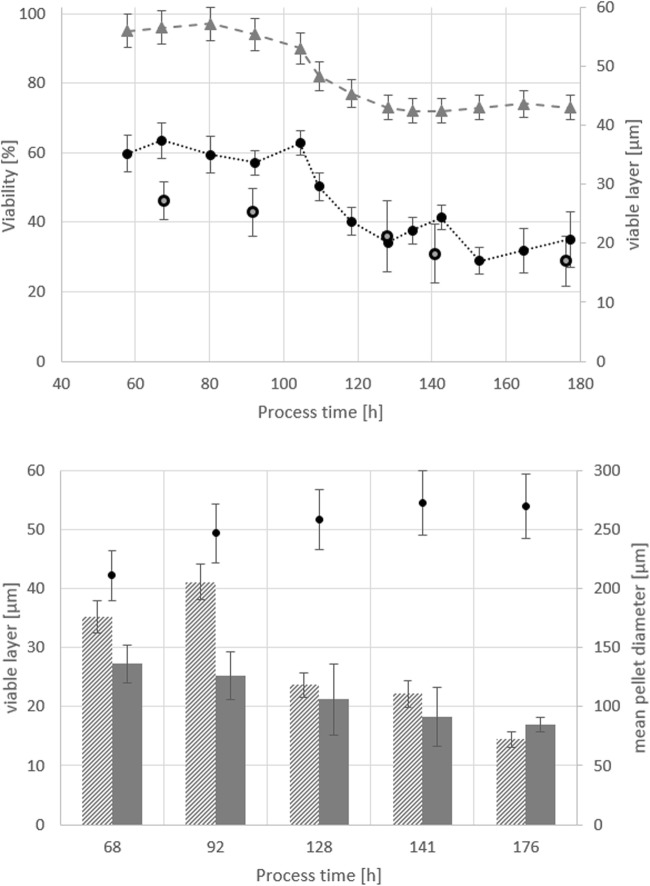
Fig. 8.
Comparison of confocal microscopy and flow cytometry, both methods employed to determine the viable layer in large elements taken from FB1 samples. Top: viability from flow cytometry (grey triangles), viable layer from flow cytometry (black circles) and viable layer from confocal microscopy (grey squares). Bottom: viable layer determined via flow cytometry (patterned bars), viable layer determined via confocal microscopy (grey bars) and average pellet diameter (black dots). Standard deviation in confocal microscopy calculated from at least 6 pellets analysed per sample

