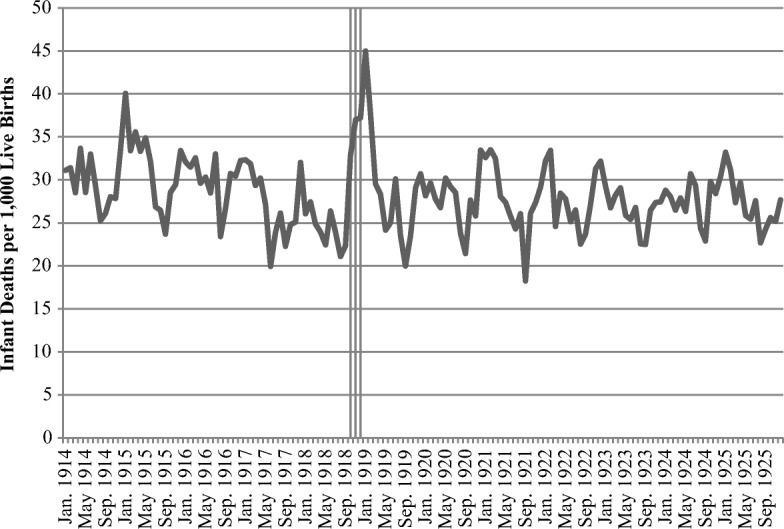
Fig. 2.

Infant deaths due to malformations and disease, expressed as a share per 1,000 live births during current month, 1914–1925. The shaded vertical bars represents the period October–December 1918. Source: Sveriges Officiella Statistik: Befolkningsrörelsen 1914–1925 and Dodsorsaker 1914–1925.
