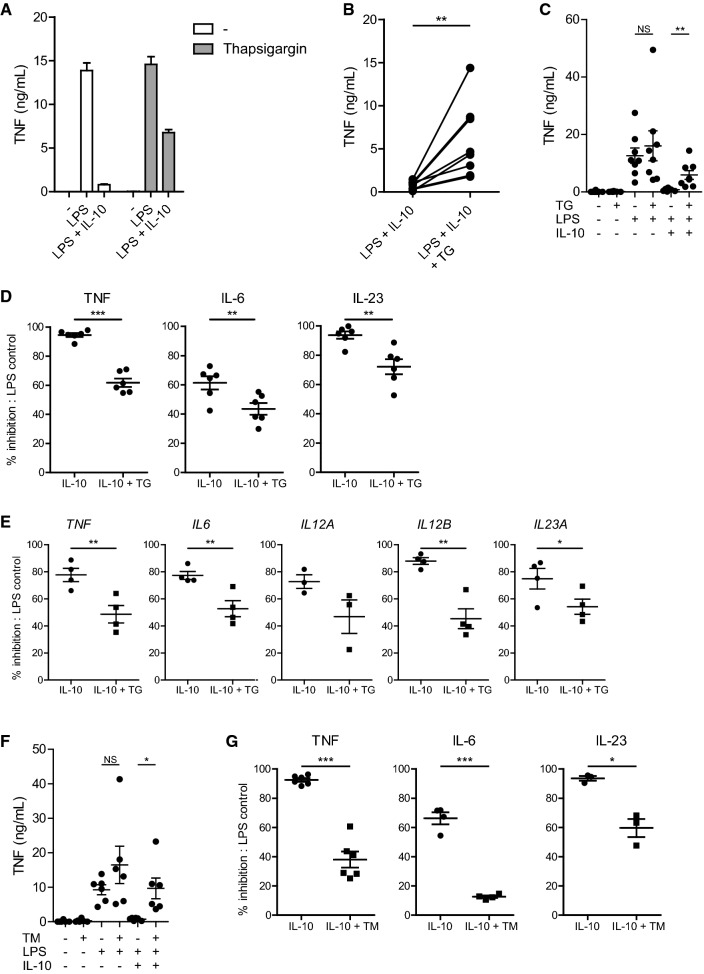
Fig. 1.
ER stress counteracts the immunosuppressive effect of IL-10 on human LPS-stimulated macrophages. a Representative example of TNF production by macrophages that were stimulated with LPS in combination or without IL-10 after pre-treatment with thapsigargin (TG) or vehicle control. Mean + SEM of triplicates. b TNF production by macrophages stimulated with LPS in combination with IL-10 after pre-treatment with TG or vehicle control. Each pair of dots represents one donor. c TNF production by macrophages stimulated with LPS in combination with IL-10 after pre-treatment with TG or vehicle control. Each dot represents mean of one donor, mean + SEM. d Macrophages were stimulated with LPS in combination with IL-10 after pre-treatment with TG or vehicle control. Data represented here is the percentage of inhibition of pro-inflammatory cytokine production by IL-10 of LPS-stimulated cells: (1 − (LPS + IL-10)/(LPS)) × 100%. Each dot represents one donor, mean + SEM. e Macrophages were stimulated with LPS in combination with IL-10 after pre-treatment with TG or vehicle control. Cells were lysed after 6 h and mRNA expression was measured using qPCR for indicated genes. Data represented here is the percentage inhibition of LPS-stimulated cells. Each dot represents one donor, mean + SEM. f TNF production by macrophages stimulated with LPS in combination with IL-10 after pre-treatment with tunicamycin (TM) or vehicle control. Each dot represents mean of one donor, mean + SEM. g Macrophages were stimulated with LPS in combination with IL-10 after pre-treatment with tunicamycin (TM) or vehicle control. Data represented here are the percentage inhibition of LPS-stimulated cells, similar as 1D. Each dot represents one donor, mean + SEM. Experiments (a–d, f, g) were performed in triplicate. After 24 h supernatants were analyzed using ELISA. *p < 0.05, **p < 0.01, ***p < 0.001, NS not significant, Student’s t test

