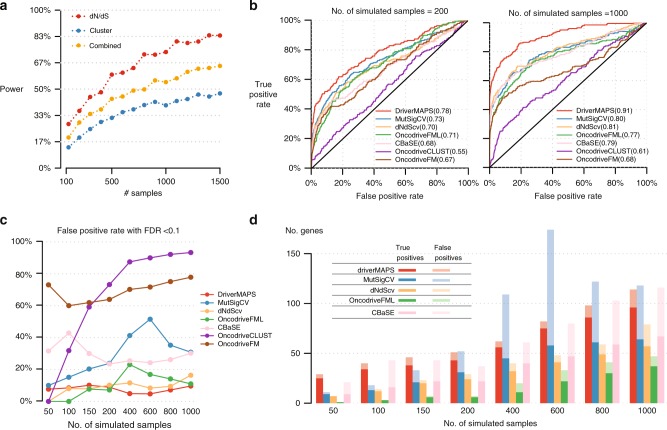
Fig. 3.
driverMAPS predicts driver genes with high accuracy and increased power in simulations. a Combining p-values from methods that use only one feature of positive selection at a time can lose power. We simulated mutations in a gene under positive selection at various sample sizes, and then assessed the power to detect this gene as positively selected. “dN/dS” captures the excess of non-synonymous mutations, “cluster” captures spatial clustering pattern of mutation, “combined” combines p-values from “dN/dS” and “cluster” using Fisher’s method. See the Methods section for details. b Receiver-operating characteristic (ROC) curves of several methods applied to genome-wide simulation data. Overall, 324 genes are chosen to be positively selected (191 TSGs and 133 OGs), and the rest of genes are neutral. We used 124 out of the 324 genes as training set for driverMAPS, and used the remaining 200 genes as the test set to generate ROC curves. Area under the ROC Curve (AUROC) values are shown in parentheses. c False-positive rate at FDR cutoff 0.1 on the simulated data. d The number of true-positive and false-positive genes at FDR < 0.1. To ensure a fair comparison, this excludes the 124 training genes used to train driverMAPS

