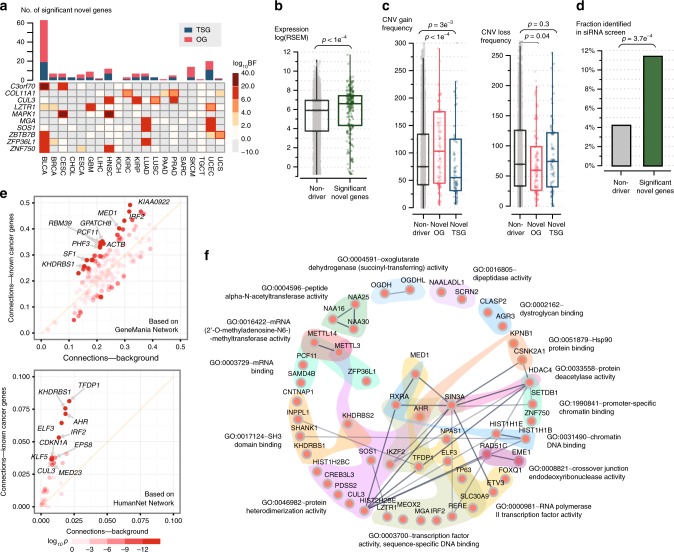
Fig. 5.
Evaluation of novel cancer genes predicted by driverMAPS. a Overview of predicted novel cancer genes. Top, the number of novel genes in each cancer type. Bottom, heatmap of Bayes factors (BF) for recurrent novel genes across tumor types. Significant BFs are highlighted by red boxes. b–d Predicted novel cancer genes show known cancer gene features. For each feature, quantification of the feature level in the novel cancer gene set was compared with the non-driver (neither known or predicted) gene set. The features are gene expression levels21 stratified by tumor types the novel genes were identified from (b), similarly stratified copy number gain/loss frequencies21 (c) and fraction of genes identified in a siRNA screen study28 (d). In panels b and c, the center line, median; box limits, upper and lower quartiles. e Enriched connectivity of a predicted gene with 713 known cancer genes (Y-axis) compared with with all genes (n = 19,512, X-axis). Connectivity of a selected gene with a gene set is defined as the number of connections between the gene and gene set found in a network database divided by the size of the gene set. Each dot represents one of the 159 novel genes with ten most enriched ones labeled. Color of dots indicates two-sided Fisher exact p-value for enrichment. f Significantly enriched GO-term gene sets (FDR < 0.1, “molecular function” domain) in predicted novel cancer genes. GO-term31, 32 gene sets are indicated by distinct background colors. Links among genes represent interactions based on STRING network database49, with darker color indicating stronger evidence

