Fig. 6.
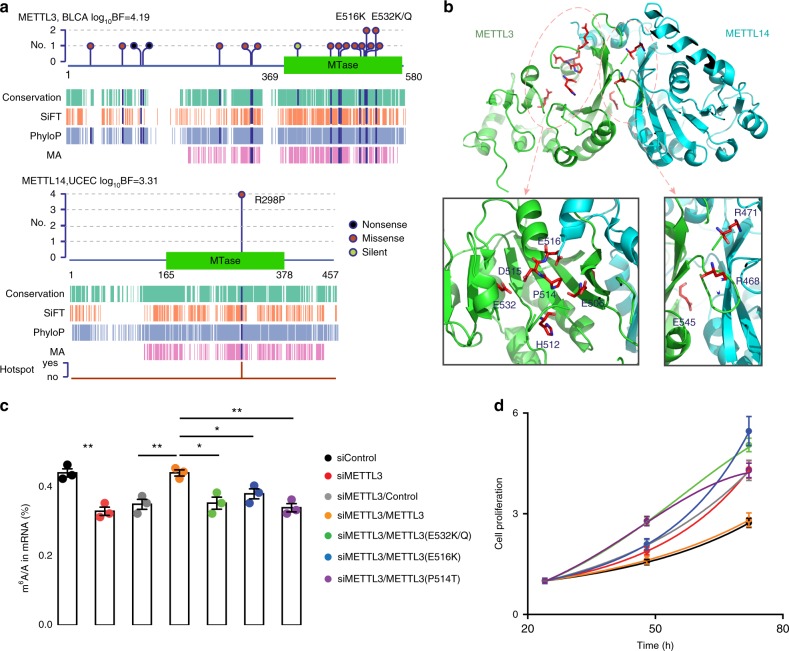
Functional validation of METTL3 as a TSG in bladder cancer. a Features of mutations in METTL3 and its heterodimerization partner METTL14. We show schematic representations of protein domain information and mark mutation positions by “lollipops”. Recurrent mutations are labeled above. Start and end of domain residues are labeled below. Dark blue bars in aligned annotation tracks indicate the mutation is predicted as “functional”. Track “Hotspot” is the indicator of whether the mutation is in hotspot or not in the driverMAPS’s spatial effect model (see Supplementary Note 3). b Structural context of METTL3 mutations reveal two regional clusters. Top, structure of METTL3 (residues 369–570) and METTL14 (residues 117–402) complex (PDB ID: 5IL0) with mutated residues in stick presentation. Bottom, zoom-in views of the two regions with mutated residues labeled. c Impaired m6A RNA methyltransferase activity of mutant METTL3 in bladder cancer cell line “5637”. LC-MS/MS quantification of the m6A/A ratio in polyA-RNA in METTL3 or control knockdown cells, rescued by overexpression of wild-type or mutant METTL3 is shown. d Mutant METTL3 decreased proliferation of “5637” cells. Proliferation of METTL3 or control knockdown cells, rescued by overexpression of wild-type or mutant METTL3 in MTS assays is shown. Cell proliferation is calculated as the MTS signal at the tested time point normalized to the MTS signal ~24 h after cell seeding. For all experiments in (c, d), the number of biological replicates is three and error bars indicate mean ± s.e.m. *p < 0.05; **p < 0.01 by two-sided t test. Legend is shared between (c) and (d)

