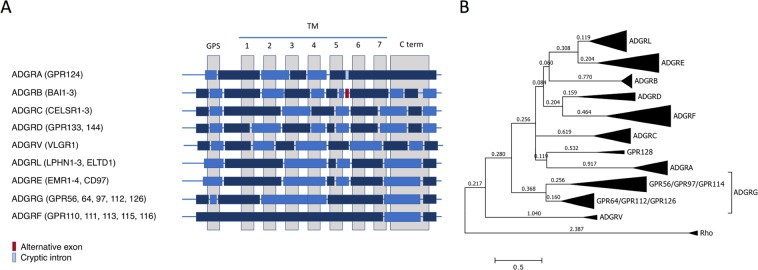
Figure 4.
Exon-intron architecture of the 7TM-encoding genomic region of aGPCR and its implication in aGPCR phylogeny. (A) Based on our mRNA variant analysis and publicly available genomic data the exon-intron structure of aGPCR groups is schematically presented. Alternating dark and light blue boxes represent GPS- and 7TM-encoding exons which are interrupted by introns. (B) The evolutionary history of vertebrate aGPCRs (human, mouse, chicken, zebrafish orthologs) was inferred by using the Maximum Likelihood method based on the JTT matrix-based model116. Thus, the 7TM domain of human, mouse, chicken, and zebrafish aGPCR orthologs were aligned and the tree with the highest log likelihood (-21466.21) is shown. Rhodopsin was used as outgroup. Initial tree(s) for the heuristic search were obtained automatically by applying Neighbor-Join and BioNJ algorithms to a matrix of pairwise distances estimated using a JTT model, and then selecting the topology with superior log likelihood value. The tree is drawn to scale, with branch lengths measured in the number of substitutions per site (next to the branches). The analysis involved 133 amino acid sequences. All positions containing gaps and missing data were eliminated. There were a total of 170 positions in the final dataset. Evolutionary analyses were conducted in MEGA7117.

