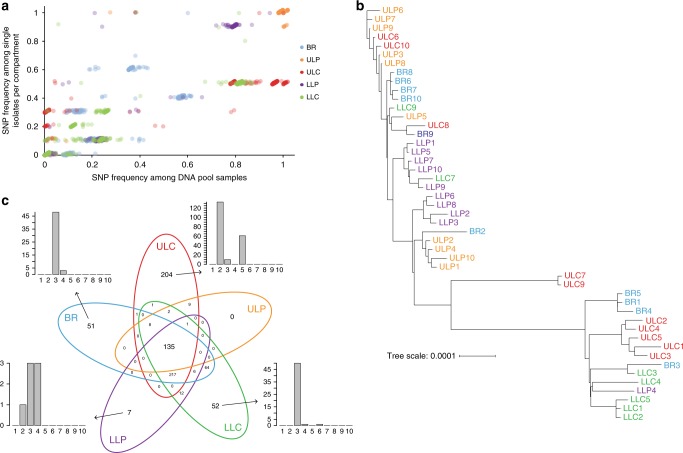
Fig. 3.
Genome sequencing of single isolates and pools. a The single-nucleotide polymorphism (SNP) frequency in 10 single isolates per compartment was correlated to the SNP frequencies in the pools (mean of two replicates) of the respective compartment. The overall linear association between the detection of SNPs in single genome vs. pooled genome sequencing was high (Pearson’s correlation coefficient r = 0.924, adjusted p value ≤0.001). Slight jitter was added to increase visibility (up to 2% change). b Genomes from single isolates were de novo assembled and the phylogenetic tree was created based on a multi-FASTA alignment of all of the core genes using PRANK. The phylogenetic tree was visualized with the iTOL online tool. Color code of the lung isolates indicates from which sub-compartment they were recovered: main bronchus = blue, upper lobe central = red, upper lobe peripheral = orange, lower lobe central = green and lower lobe peripheral = purple. c Venn diagram of the distribution of the 770 identified SNPs in the isolates across the five lung compartments. The bar plots indicate the number of the compartment-specific SNPs that are shared by a number of individual isolates among the overall 10 sequenced isolates from each of the compartment. Source data are provided as a Source Data file

