Fig. 5.
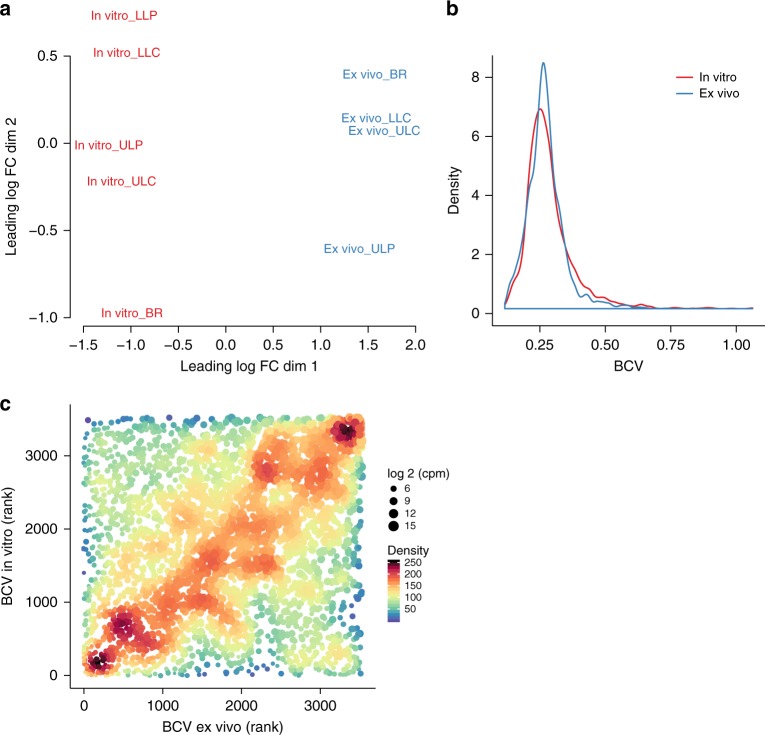
Variances of gene expression in vitro and ex vivo. To reduce the influence of sequencing depth on variance, sample reads were subsampled to the same level and filtered (counts per million (cpm) in all samples ≥5). Distribution of normalized reads was comparable in all samples after data processing (Supplementary Fig. 3a). In addition, subsampling did not affect distribution of normalized reads and also the number of remaining genes after filtering was similar (Supplementary Fig. 3a). The ex vivo LLP transcriptional profile has been removed prior analysis because <500,000 reads were obtained. a Multidimensional scaling plot of ex vivo and in vitro samples. b Density plot of the biological coefficient of variation (BCV) for the ex vivo and in vitro transcriptional profiles. The median values were the same for both conditions (ex vivo: 0.265 (95% confidence interval (CI) = 0.2633–0.2668); in vitro: 0.267 (CI = 0.2643–0.2693); CI’s were calculated using the basic bootstrap method (5000 iterations). Different data processing did not have a major effect on the outcome (Supplementary Fig. 3c, d). c A rank correlation was performed to test if same genes have comparable BCV’s ex vivo and in vitro (Spearman’s rank correlation coefficient = 0.233, p value = 8.2 × 10–45). The point colors and sizes indicate the density of the plots and the sequencing depth of the genes (log 2 cpm), respectively. Source data are provided as a Source Data file

