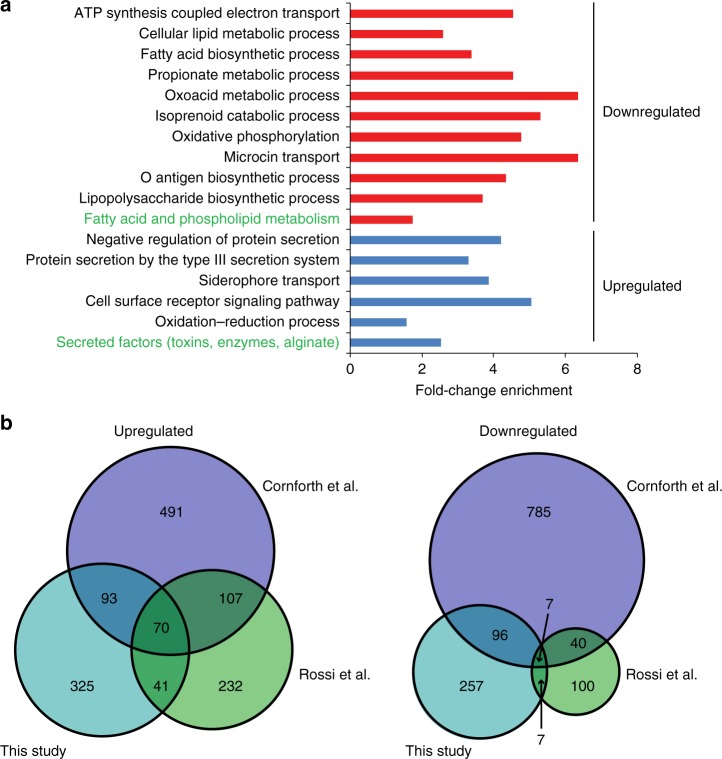
Fig. 6.
Cystic fibrosis (CF) habitat-specific transcriptional profile. Genes that were differentially expressed (log 2 fold change (FC) ≥1.5) in the ex vivo transcriptional profile compared to the in vitro condition were assigned to GO terms and PseudoCAP categories (green text). The enrichment factor is depicted in a and provides information on the proportion of regulated genes belonging to a functional category relative to the proportion of all genes (that were considered for differential expression analysis) belonging to that category. Categories with significantly enriched genes are depicted (hypergeometric test, adjusted p value ≤0.05), while fold-change enrichment is indicated at the x axis. Source data are provided as a Source Data file. b Differentially expressed genes (ex vivo vs. in vitro) identified in this study (log 2 FC ≥1.3, adjusted p value <0.05) were compared with those identified in two previous studies, which analyzed the P. aeruginosa transcriptional profile in CF sputum samples (Rossi et al.23 and Cornforth et al.24 (log 2FC ≥1.3, adjusted p value <0.05)). Lists of the overlapping genes are found in Supplementary Data 2

