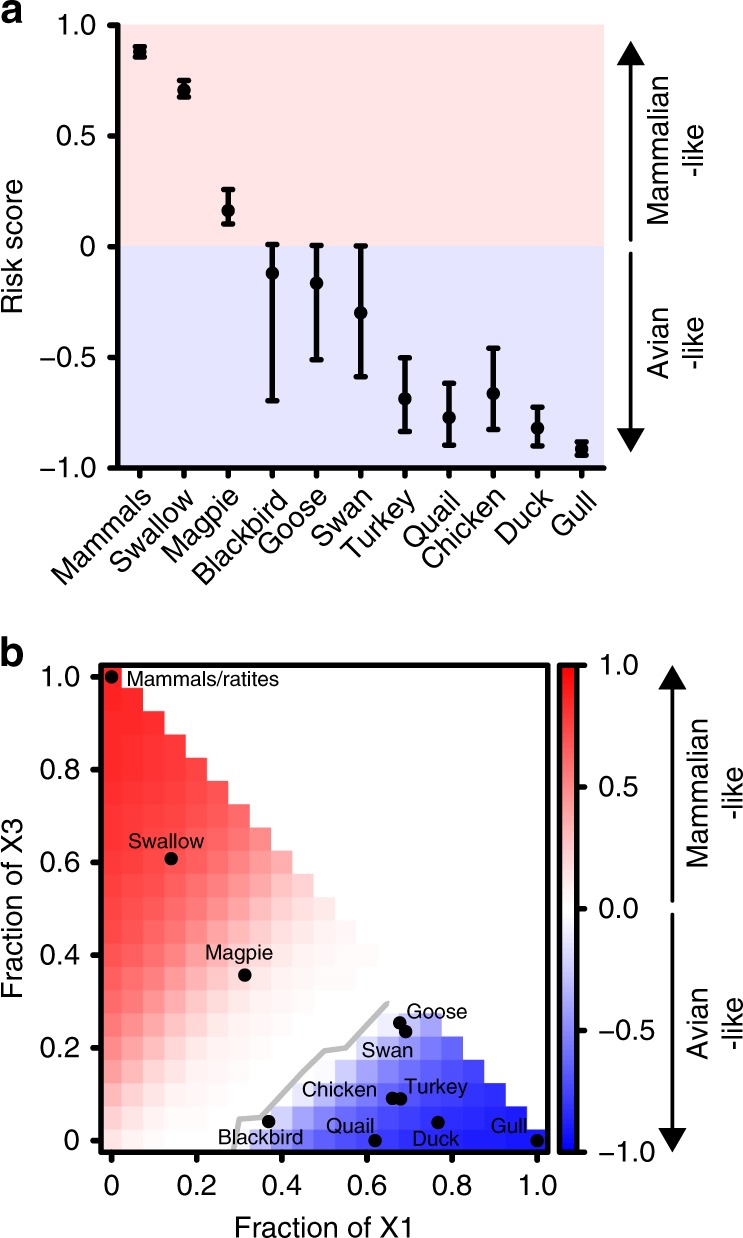
Fig. 6.

Evaluating the risk of different species selecting for mammalian-like IAV adaptations. a Estimated relative risk scores for each indicated species to select for avian- or mammalian-like IAV vPol adaptations. The dots indicate the risk score prediction based on the best estimates of virus production rates alongside the 95% bootstrap confidence intervals (error bars). b Heat-map of risk scores based on the mathematical model and using the best estimates of virus production rates. Axes indicate fraction of the total ANP32A complement represented by X1 or X3, allowing threshold values for selection (gray line) to be determined
