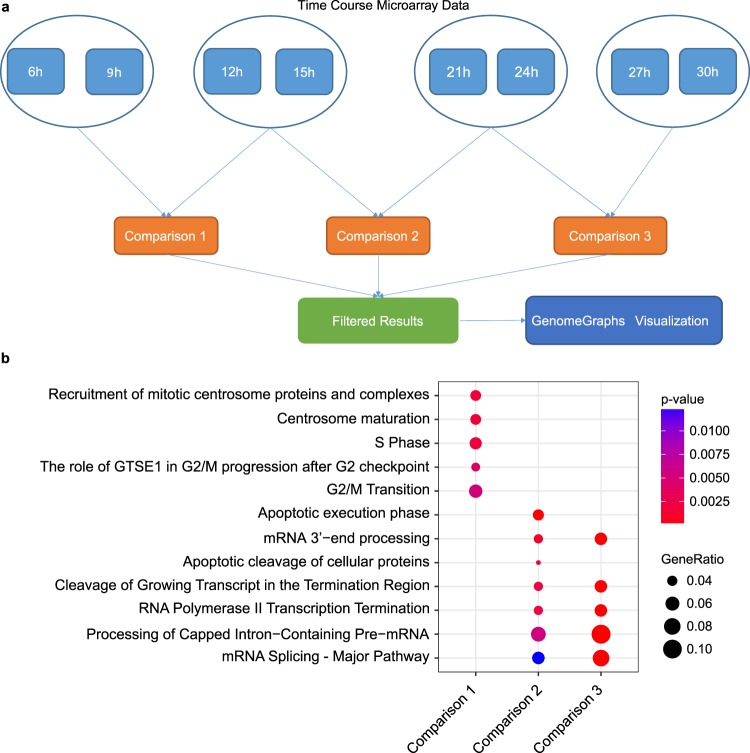
Figure 4.
Numerous alternative splicing events were detected in the time-course data for the HD-MY-Z cell line. (a) Experimental design for the grouping and subsequent analysis of the time-course microarray data with the EventPointer R package. The time points were grouped in four sets that resulted in three EventPointer comparisons. The data obtained with EventPointer was additionally filtered for p < 0.01 and absolute delta-PSI > 0.1. The selected genes were visualized at the probe set level with the GenomeGraphs package. (b) Enrichment analysis for Reactome pathways for the genes detected to be alternatively spliced in the three comparisons. The gene ratio denotes the ratio between the number of the genes associated with the term and the total number of genes associated with the term in the pathway.

