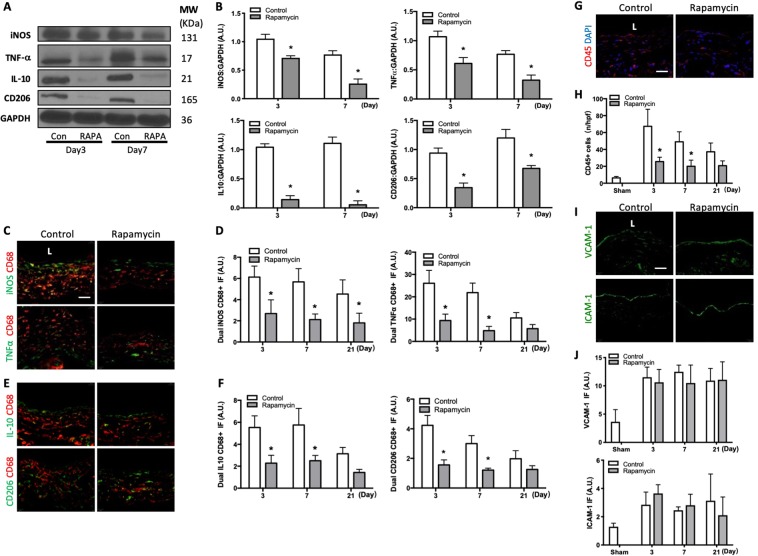
Figure 2.
Reduced M1- and M2-type macrophages with rapamycin. (A) Representative Western blot showing iNOS, TNF-α, IL-10 and CD206 protein expression levels in AVF treated with rapamycin or control (day 3 and 7). (B) Graphs showing densitometry measurements of iNOS, TNF-α, IL-10 and CD206 expression in the AVF after control or rapamycin treatment, normalized to GAPDH. iNOS: p = 0.0011 (ANOVA). *p = 0.0241, day 3; *p = 0.0054, day 7 (post hoc); n = 2–3. TNF-α: *p = 0.0020 (ANOVA). *p = 0.0223, day 3; *p = 0.0250, day 7 (post hoc); n = 2–3. IL-10: *p < 0.0001 (ANOVA). *p = 0.0011, day 3; *p = 0.0006, day 7 (post hoc); n = 2–3. CD206: p = 0.0013 (ANOVA). *p = 0.0126, day 3; *p = 0.0200, day 7 (post hoc); n = 2–3. (C) Photomicrographs showing representative dual IF for CD68 (red) and iNOS (green, top row) or CD68 (red) and TNF-α (green, bottom row) in AVF after control or rapamycin treatment (day 7). Scale bar, 25 μm. L, lumen. (D) Bar graphs showing quantification of dual IF after control or rapamycin treatment. Left graph, iNOS-CD68: p < 0.0001 (ANOVA). *p = 0.0006, day 3; *p = 0.0004, day 7; *p = 0.0073, day 21 (post hoc); n = 5. Right graph, TNF-α-CD68: p < 0.0001 (ANOVA). *p < 0.0001, day 3; *p < 0.0001, day 7 (post hoc); n = 5. (E) Photomicrographs showing representative dual IF for CD68 (red) and IL-10 (green, top row) and CD68 (red) and CD206 (green, bottom row) in control or rapamycin treated AVF (day 7). (F) Bar graphs showing quantification of dual IF after control or rapamycin treatment (day 7). Left graph, IL-10-CD68: p < 0.0001 (ANOVA). *p < 0.0001, day 3; *p < 0.0001, day 7 (post hoc); n = 5. CD206-CD68: p < 0.0001 (ANOVA). *p < 0.0001, day 3; *p < 0.0001, day 7 (post hoc); n = 5. (G) Photomicrograph of representative of CD45+ cells in control or rapamycin treated mice AVF (day 7). (H) Bar graph showing number of CD45 immunoreactive cells in AVF after control vs rapamycin treatment; p < 0.0001 (ANOVA); *p < 0.0001, day 3; *p = 0.0020, day 7; *p = 0.2110, day 21 (post hoc); n = 5. (I) Representative photomicrographs showing VCAM-1 (top row) and ICAM-1 (bottom row) IF in AVF after control or rapamycin treatment (day 7). (J) Bar graphs showing relative quantification of VCAM-1 and ICAM-1 intensity in AVF, normalized to sham vessels. VCAM-1: p = 0.3162 (ANOVA); n = 6. ICAM-1: p = 0.9280 (ANOVA); n = 4–6. Data represent mean ± SEM.

