Figure 7.
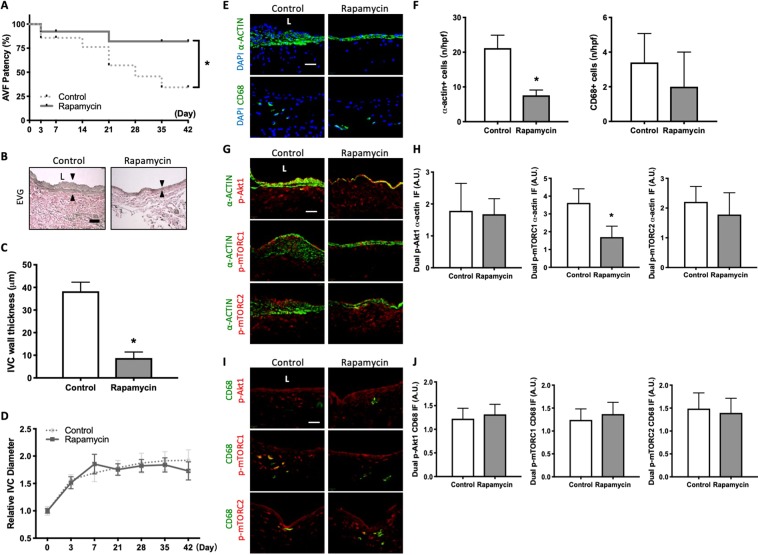
Rapamycin treatment is associated with reduced AVF wall thickness but increased AVF patency. (A) Line graph showing AVF patency rate in mice treated with control vs rapamycin IP injections. *P = 0.0495 (Log-rank), n = 13–14 in each arm. (B) Representative photomicrographs showing AVF wall thickness in mice treated with control or rapamycin (day 42). Arrowheads denote wall thickness. Scale bar, 25μm. L, lumen. (C) Bar graph showing AVF wall thickness in after control or rapamycin treatment (Day 42); *p < 0.0001 (t test). n = 5. (D) Line graph showing relative AVF diameter in mice treated with control or rapamycin, normalized to day 0; p = 0.2603 (ANOVA); n = 6–8. (E) Photomicrographs of represen tative IF of α-actin+ (top row) and CD68+ cells (bottom row) in control or rapamycin treated mice AVF (day 42). (F) Bar graphs quantifying number of α-actin+ (left) and CD68+ cells (right) in AVF after control or rapamycin treatment; α-actin: *p < 0.0001 (t-test); CD68: p = 0.2643 (t test); day 42. n = 5. (G) Photomicrographs of representative dual IF of a-actin (green) and p-Akt1 (red, first row), p-mTORC1 (red, second row) or p-mTORC2 (red, third row) in AVF after control or rapamycin treatment (day 42). (H) Bar graphs showing quantification of dual IF in AVF after control or rapamycin treatment (day 42). p-Akt1-α-actin: p = 0.8126 (t test); p-mTORC1-α-actin: *p = 0.0026 (t test). p-mTORC2-α-actin: p = 0.3206 (t test); n = 5. (I) Photomicrographs of representative dual IF for CD68 (green) and p-Akt1 (red, first row), p-mTORC1 (red, second row) or p-mTORC2 (red, third row) in AVF after control or rapamycin treatment (day 42). (J) Bar graphs showing quantification of dual IF in AVF after control or rapamycin treatment (Day 42). p-Akt1-CD68: p = 0.5195 (t test). p-mTORC1-CD68: p = 0.4453 (t test). p-mTORC2-CD68: p = 0.6633 (t test); n = 5.

