Fig. 6.
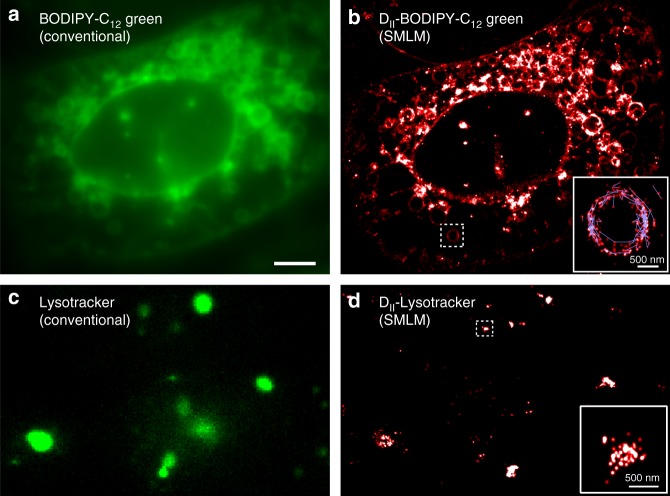
SMLM and tracking of fatty acid analogs and LysoTracker Green using DII-states in living mammalian cells. a Conventional fluorescence image of BODIPY-C12 in U2OS cells. LDs of various sizes become visible and are generally bigger compared to yeast. b Super-resolution microscopy image of DII states of BODIPY-C12. Zoom: Superposition of single-molecule localizations (red) and traces (blue) reveal the motion of fatty acid analogs along the periphery of LDs. c Conventional fluorescence image of LysoTracker Green with 488 nm excitation. d SMLM images of DII states of LTG with 561 nm excitation. Zoom: SMLM image of an immobile lysosome. Scale bar: 5 µm; insets: 500 nm

