Figure 3.
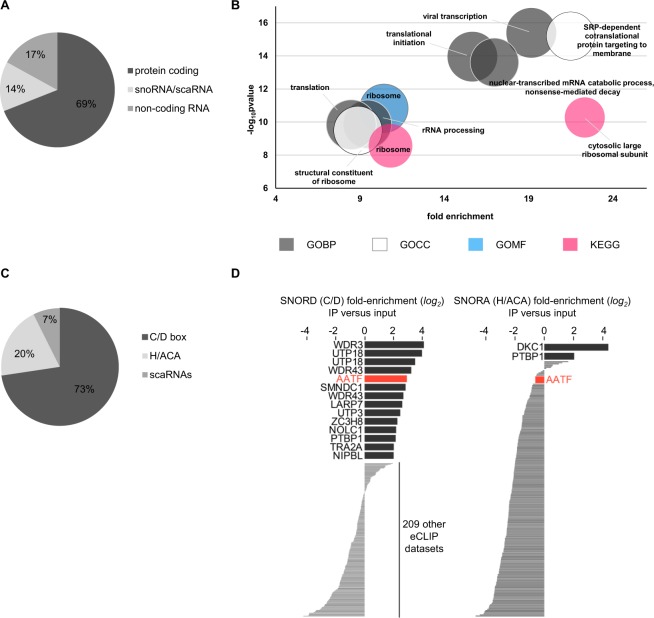
AATF interacts with coding and non-coding RNA species. (A) Pie chart depicting the distribution of RNA biotypes bound by AATF other than rRNA. 69% of transcripts other than rRNA bound by AATF are protein-coding, (14%) snoRNA and scaRNA, and “non-coding RNA” biotypes (17%) encompass lincRNA, miRNA and antisense RNA. (B) Bubble chart depicting the functional analysis of mRNA transcripts bound by AATF showing the terms contained in the top functional annotation cluster as identified using the DAVID Bioinformatics online tool66 (for the 292 eCLIP targets showing significant peaks in at least two experiments, Suppl. Table 1). GO terms are plotted according to fold enrichment and −log10 of the respective p-value, with size of the bubble increasing proportionally the number of genes contained in the respective cluster. (C) Pie chart showing the proportions of snoRNAs bound by AATF. Among the transcript biotype group of snoRNAs AATF preferentially binds C/D box snoRNAs, with 73% of bound snoRNAs belonging to this subtype. Box H/ACA snoRNAs comprise 20% and scaRNA 7% of transcripts bound by AATF. (D) Bars indicate the fold-enrichment (or depletion) in immunoprecipitation versus input for C/D-box snoRNAs and H/ACA-box snoRNAs in all ENCODE eCLIP datasets. AATF is noted in red, and other datasets with at least 4-fold enrichment are indicated by name.

