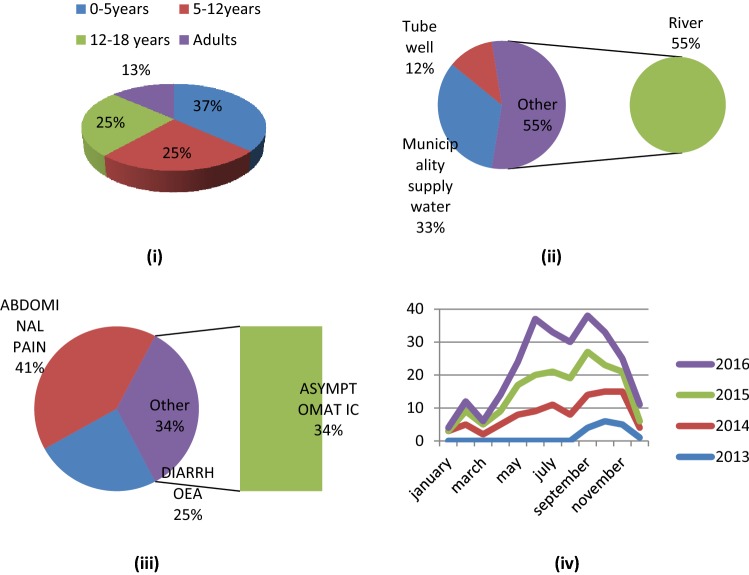
Fig. 10.
i Pie chart showing the rate of infection in different age group, 0-5 years = 98, 5-12 years = 66, 12-18 years = 67 and adult = 36. ii Pie chart showing rate of infection consuming different water source, consuming river water = 147, consuming municipality supply water = 89 and consuming tube well water = 31. iii Pie chart showing the symptoms of infection among the affected individuals, having abdomoinal pain = 109, diarrhoea = 66 and symptomless = 92. iv Line graph representing seasonal outbreak of Giardia intestinalis

