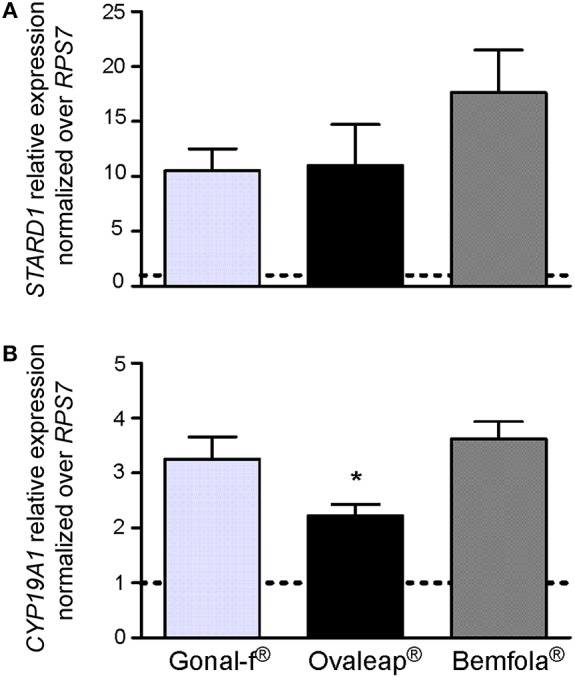
Figure 4.

STARD1 and CYPA19A1 gene expression analysis. The expression of STARD1 (A) and CYPA19A1 (B) gene was evaluated in hGLC stimulated for 12 h with the EC50 of Gonal-f® or biosimilars (12 ng/ml Gonal-f® and Ovaleap®, 24 ng/ml Bemfola®) by real-time PCR. Each value was normalized over the RPS7 gene expression (means ± SEM; n = 4). Unstimulated cells served as control and are indicated as a dotted line. (*= significant vs. Bemfola®, Kruskal Wallis test; p < 0.05).
