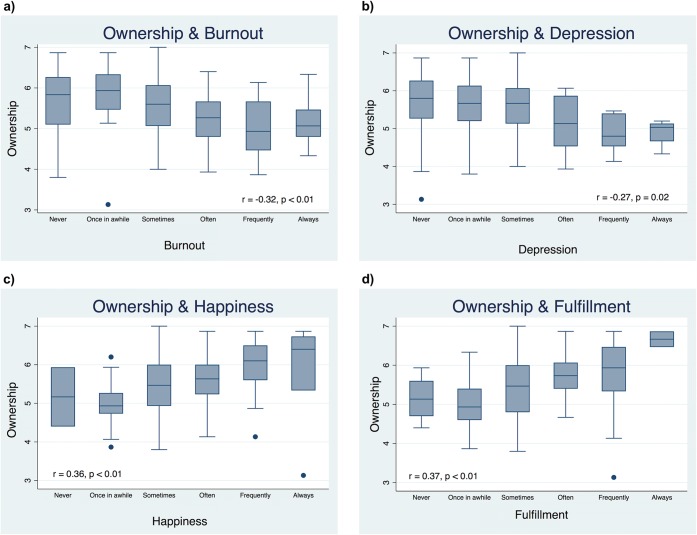
Figure 3.
Relationship between ownership and burnout, depression, happiness, and fulfillment. Graphical depiction of the relationship between ownership and a burnout, b depression, c happiness, and d fulfillment. The Y -axis represents mean ownership scores and the X -axis represents responses to the 6-point Likert scale measuring each affect ranging from 1 = never to 6 = always. For example, respondents were asked about their perceived degree of burnout as follows: Over the last month (or, 2 weeks), I felt burnt out. Each graph depicts the distribution of mean ownership scores according to the frequency of each affect by using box plots. Pairwise correlation coefficients and the significance levels are also depicted.

