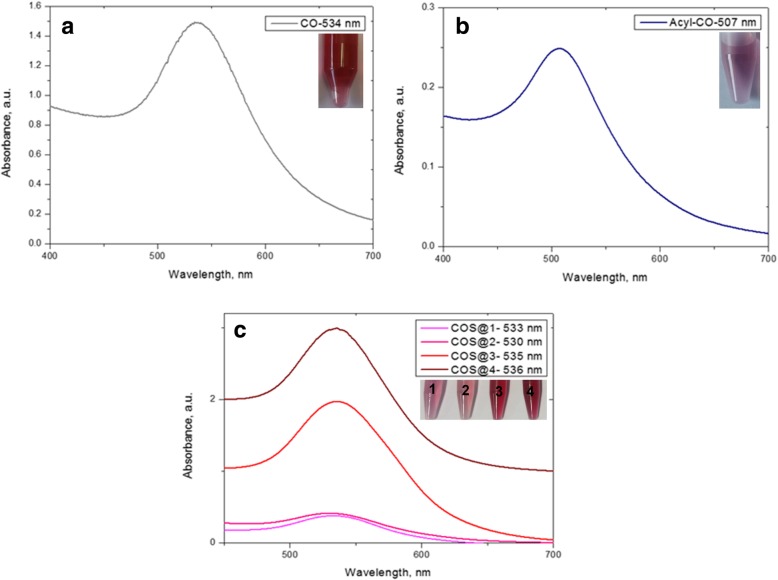
Fig. 3.
UV-Vis spectra for nanocomposites. Values in the insets correspond to the maximum wavelength of the localized surface plasmon resonance. These maxima were as follows: for CO-AuNPs at 534 nm (0.1 M NaBH4) (a), for Acyl-CO-AuNPs at 507 nm (b), and for COS-@n-AuNP chitosan oligosaccharide at 533, 530, 535, 536 nm for each at 1–4 different thickness nanocomposite preparations (c)

