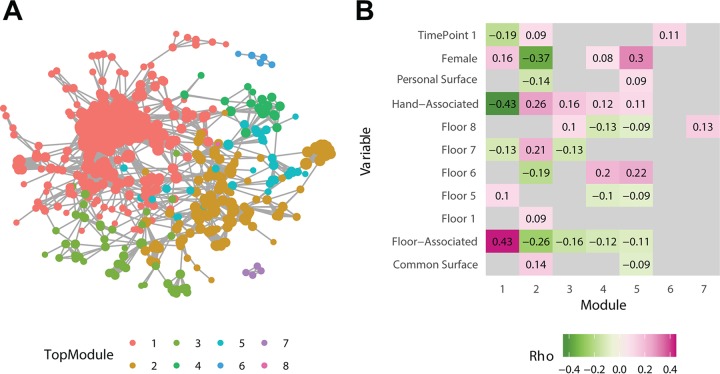
FIG 4.
(A) A graph generated using random forest model proximity scores, trained to distinguish individuals. It is thresholded by proximity less than 0.076. It is colored by Top Module, the highest-level clustering produced by Infomap. Module 1 is mostly composed of shoe and floor samples, similarly to that shown in Fig. 3. (B) Significant Spearman correlations (P < 0.05) between each module and various metadata categories.

