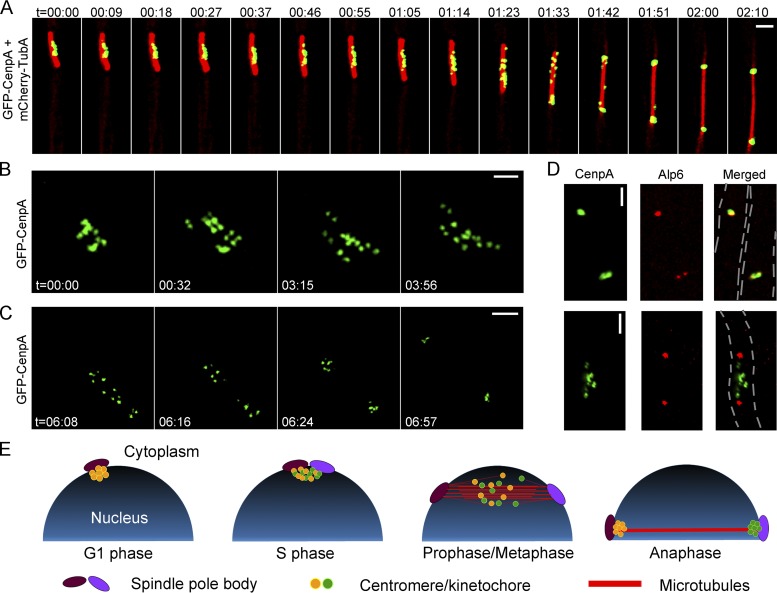
FIG 2.
Kinetochores decluster momentarily but arrange randomly on the spindle axis before sister kinetochore separation during anaphase in M. oryzae. (A) Time-lapse imaging of strain MGYF07 cells exhibited that the GFP-CenpA signals separated from each other and moved along the mitotic spindle (mCherry-TubA) (see also Movie S1 at https://figshare.com/articles/MoCEN_movies/8282066). The images shown are maximum projections of 0.3-μm-spaced Z stacks. t = minutes:seconds. Bar, 2 μm. (B) High-resolution time-lapse images showing the declustering of kinetochores (GFP-CenpA) during the process of mitosis in strain MGYF01 (see also Movie S2 at https://figshare.com/articles/MoCEN_movies/8282066). The images were acquired with Z projections of 0.17-μm step size. t = minutes:seconds. Bar, 1 μm. (C) High-resolution time-lapse images of MGYF01 cells showing the segregation dynamics of sister kinetochores in daughter cells during the metaphase to anaphase transition and the final reclustering of kinetochores in postanaphase cells (see also Movie S3 at https://figshare.com/articles/MoCEN_movies/8282066). t = minutes:seconds. Bar, 2 μm. (D) Spatial organization of kinetochores (GFP-CenpA) and SPBs (Alp6-mCherry) in strain MGYF08 during the premitotic stage (upper panel) and early mitosis (lower panel). Bar, 2 μm. (E) A schematic depiction of centromere dynamics at specific stages of the cell cycle in M. oryzae. For simplification, chromosomes and astral microtubules are omitted in the schematic.

