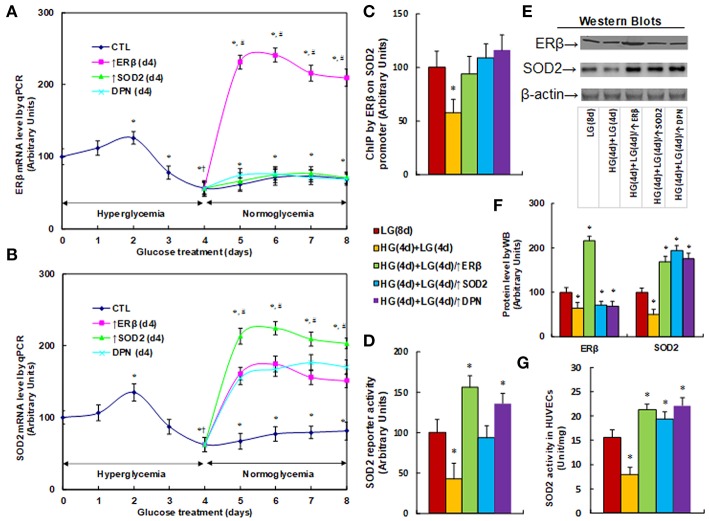
Figure 2.
ERβ expression diminishes hyperglycemia-induced persistent SOD2 suppression. (A,B) HUVECs were incubated in hyperglycemia (25 mM glucose) for 4 days, and then switched to normoglycemia (5 mM glucose) for an additional 4 days. On day 4, cells were either infected by empty vector (CTL), ERβ lentivirus (ERβ↑), or SOD2 lentivirus (SOD2↑), or treated by 100 μM ERβ agonist (DPN) for a subsequent 4 days, and the cells were harvested for mRNA analysis of ERβ (A) and SOD2 (B), n = 4. *P < 0.05, vs. day 0 group; †P < 0.05, vs. day 3 group; #P < 0.05, vs. day 4 group. (C-G) The HUVECs cells were treated either in normoglycemia (5 mM) for 8 days (LG(8d)), or in hyperglycemia (HG in 25 mM glucose) for 4 days followed by normoglycemia (LG in 5 mM glucose) for an additional 4 days (HG(4d)+LG(4d)), or the cells were infected at day 4 by either ERβ lentivirus (HG(4d)+LG(4d)/ERβ↑), or SOD2 lentivirus (HG(4d)+LG(4d)/SOD2↑), or treated by ERβ agonist (HG(4d)+LG(4d)/DPN) for a subsequent 4 days, and the cells were harvested for further analysis. (C) ChIP analysis by ERβ antibody on SOD2 promoter, n = 4. (D) SOD2 reporter activity assay, n = 5. (E) Representative picture for western blots. (F) Protein quantitation for (E), n = 4. (G) SOD2 activity assay, n = 5. *P < 0.05, vs. LG(8d) group. Data are expressed as mean ± SEM.

