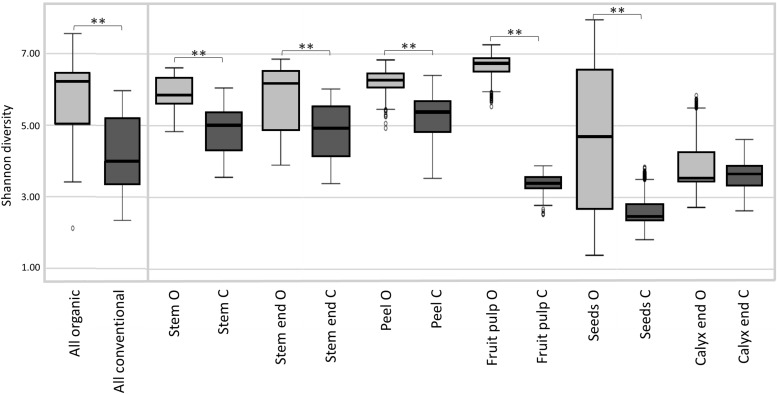
FIGURE 2.
Microbial diversity estimates of organically and conventionally managed apples and apple tissues. Suffixes O and C of carposphere tissue in the bottom legend, denote for organic and conventional management, respectively. Significant differences in Shannon diversity estimates of the apple management analogs are indicated by brackets and asterisks.

