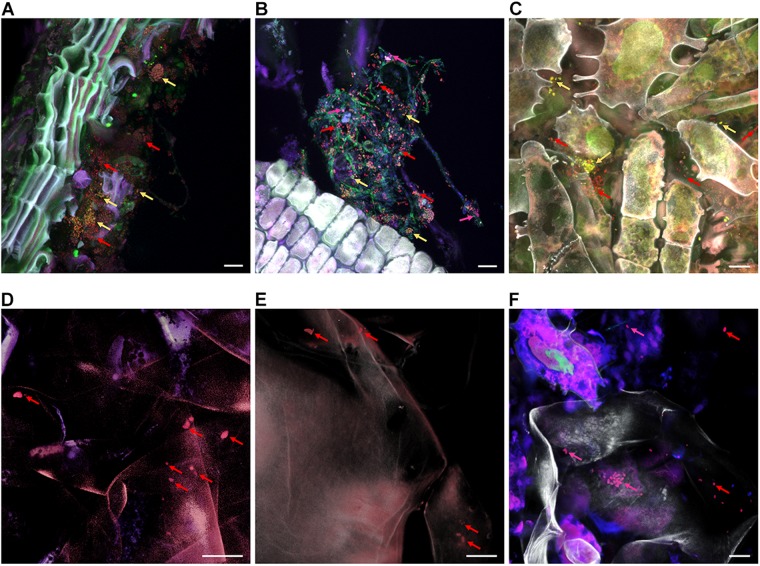
FIGURE 7.
FISH-CLSM micrographs showing bacterial colonization of organic apple tissues. Panels (A–F) visualize stem, stem end, peel, fruit pulp, seeds and calyx end samples, respectively. Bacteria were stained with FISH probes specific for Gammaproteobacteria (fluorescing pink and indicated by pink arrows), Firmicutes (yellow) and remaining bacteria of other classes (red); host structures are fluorescing white. Bar on the bottom right of each panel denotes for 10 μm.

