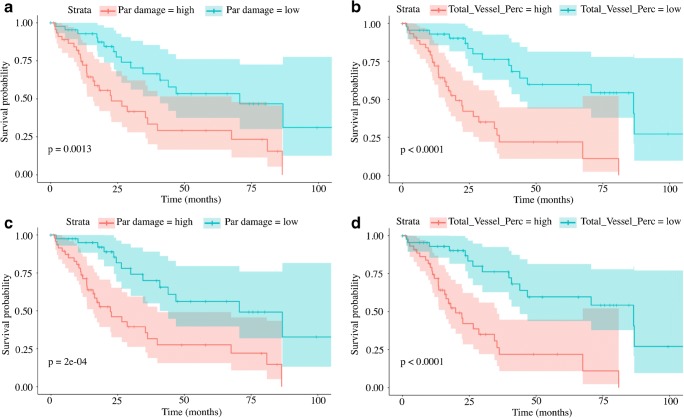
Fig. 3.
Kaplan–Meier plots of survival analysis. Patients were classified according to their median (a is parenchymal damage, b is total vessel percentage) and according to the optimal cutoff (d is parenchymal damage and e is total vessel percentage) values, as described in the methods section. The parenchymal damage was obtained by adding up ground-glass opacification, reticular pattern, and honeycombing to express the total burden of disease in the lung parenchyma; the total vessel percentage reflects the percentage of vessels in the lung parenchyma. The log-rank test demonstrated a statistically significant worse prognosis in patients with parenchymal damage greater than 18.9 (median value, p = 0.0013, curve a) and 18.5 (optimal cutoff, p = 0.0002, curve c). Similarly, a vessel percentage greater than 3.8% (median value, p < 0.0001, curve b) and 3.66% (optimal cutoff, p < 0.0001, curve d) predicted significantly worse prognosis. Using the optimal cutoff calculated in R improved the capacity to differentiate between patients with better and worse prognosis, using both parenchymal damage and total vessel percentage

