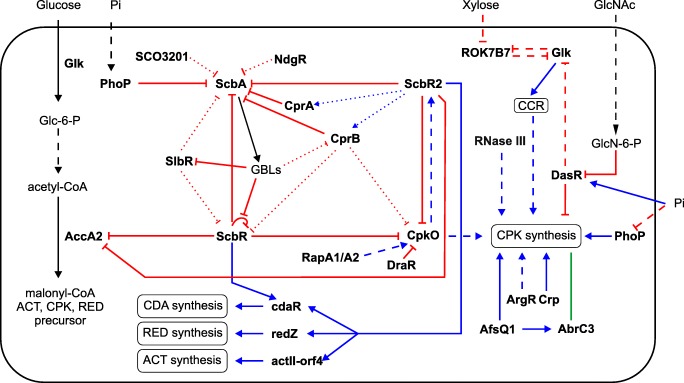
Fig. 2.
The regulatory pathways interconnected with cpk cluster regulation. The diagram links nutrient signals with pleiotropic and pathway-specific regulators affecting coelimycin synthesis and the feedback effect of cpk cluster genes. The blue lines ending with an arrow indicate activation. The red lines ending with a bar indicate repression. The green line with no ending indicates evidence of DNA binding, but the effect on transcription is unknown. The solid lines indicate the direct effect (DNA or ligand binding), dashed lines indicate indirect effect, and dotted lines indicate proposed but direct interactions. The thin black lines indicate transport or transformation of chemical compounds. Only the effects of butanolide system proteins ScbR and ScbR2 on other biosynthetic gene clusters were included in the diagram as they most accurately represent the impact of cpk cluster transcription on the production of other antibiotics. CCR–carbon catabolite repression. See the text for further information and references

