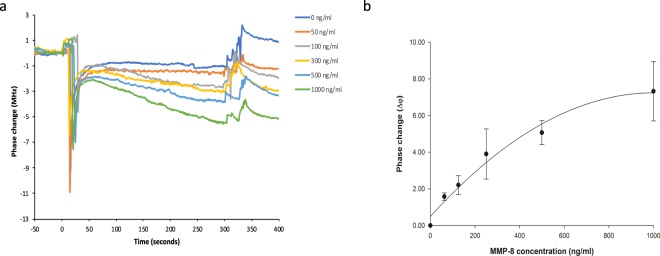
Figure 1.
Response of the biosensor to hrMMP-8. Biosensor phase change response to increasing concentrations of hrMMP-8 (0–1000 ng/ml). Overlaid plots of raw data from a single experiment showing phase shifts recorded as a function of time after the addition of the detection antibody at t = 0 (a). Graph illustrating the relationship of relative phase change between samples containing MMP-8 and controls (Δφ) (b). Phase change measurements were made after final buffer wash (see Methods). Data are derived from 3 independent experiments each comprising parallel duplicate measurements on separate microchips and are presented as means ± SD (n = 6).

