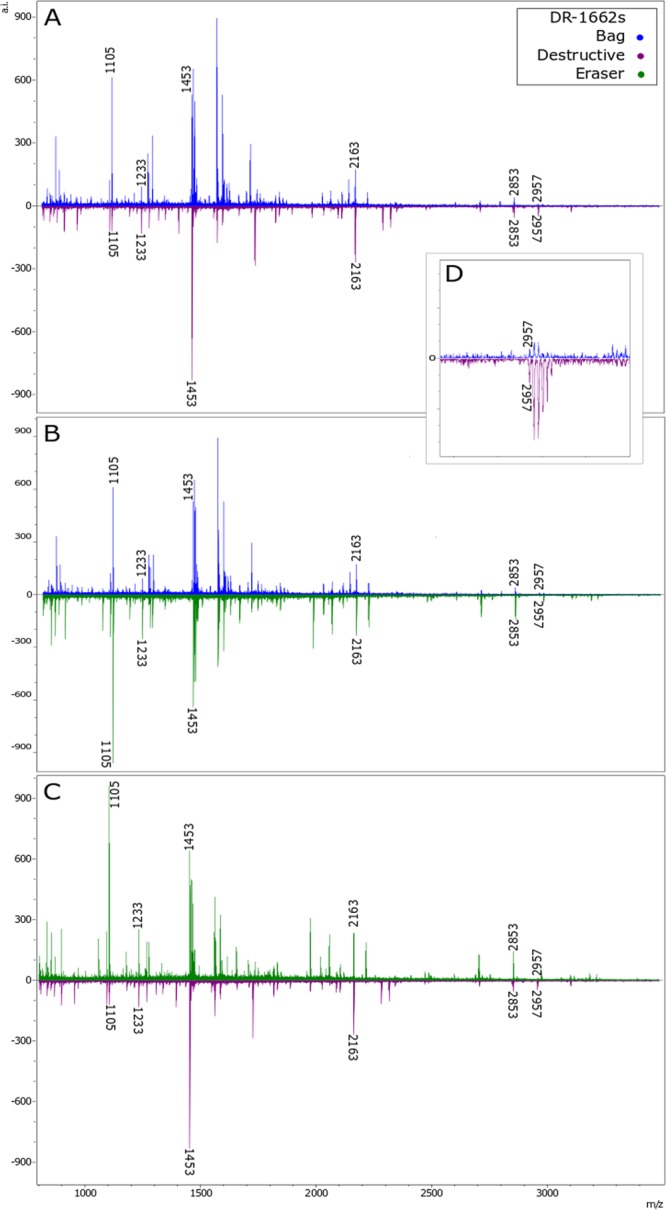
Figure 4.

Comparison of MALDI-ToF-MS spectra from the bag, eraser and destructive ZooMS methods for sample DR-1662s, showing peaks used to identify it as bear. (A) Bag vs destructive; (B) bag vs eraser; (C) eraser vs destructive; (D) close up of spectra in (A) showing poor resolution of high molecular weight peptides in the bag compared to the destructive method. Bag method spectra shown in blue, eraser method spectra in green and destructive method spectra in purple.
