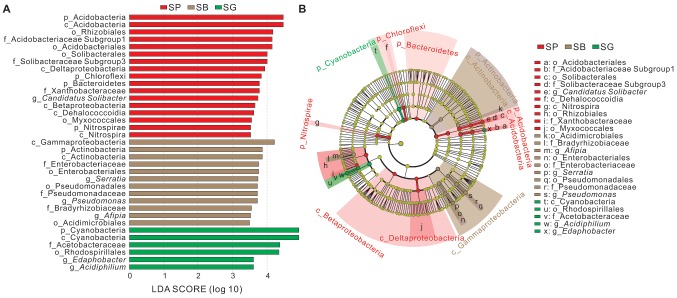
Figure 4.
Indicator groups analysis of bacterial communities in different microhabitats of S. palustre with LDA SCORE > 3.5 (A) and taxonomic cladogram (B) through linear discriminant analysis effect size (LEfSe). Nodes from inside to outside represent the phylogenetic levels from phylum to genus, respectively. Yellow nodes represent taxa that do not significantly discriminate among microhabitats. Significant discriminant taxa of S. palustre peat, S. palustre brown part, and S. palustre green part are highlighted in red, brown, and green, separately. The dimension of nodes is positively correlated with the relative abundance of taxon. Abbreviations are described in Figure 3.

