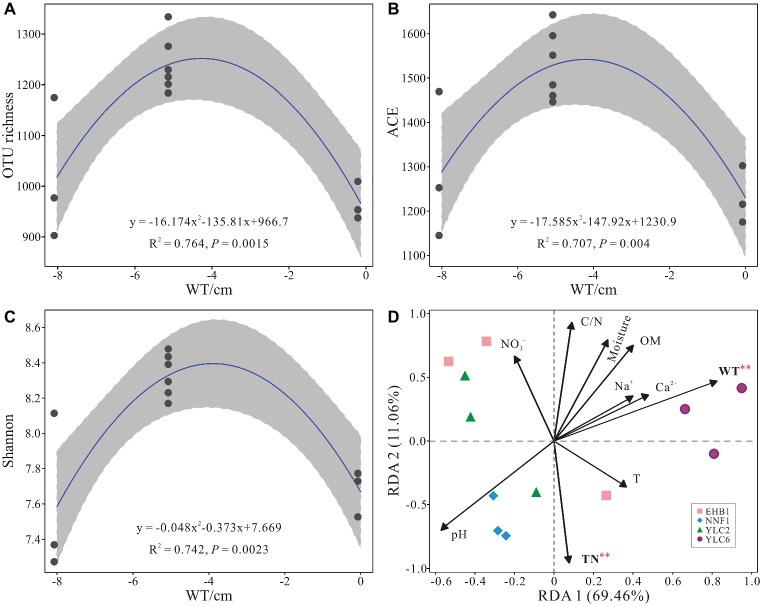
Figure 5.
Relationship between water table and alpha diversity of bacterial communities from S. palustre peat samples (A–C) and redundancy analysis showing the relationships between environmental factors and bacterial communities from S. palustre peat samples (D). Significant levels (p < 0.01) are marked with red asterisk based on permutation test (n = 1,000). Abbreviations of environmental factors and sampling site are the same as those in Figure 2.

