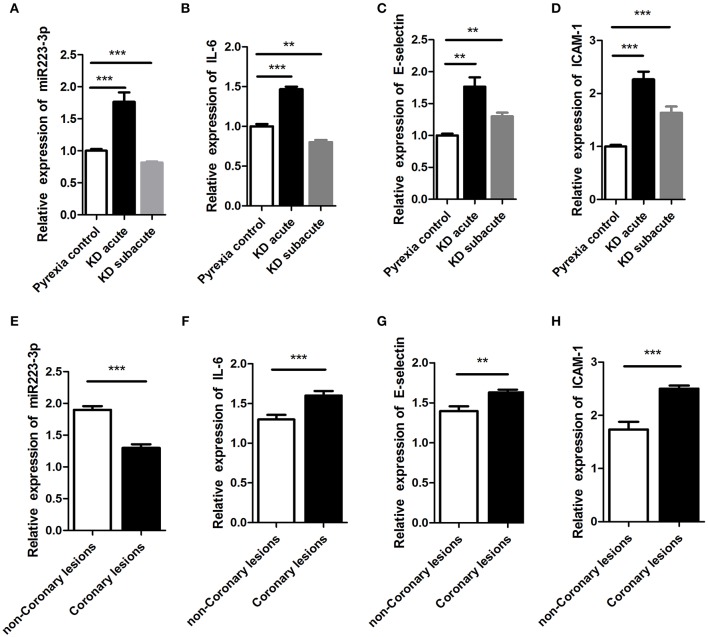
Figure 2.
The expression of miR-223-3p was seen to increase in acute stage of KD. panel (A–D) represent the relative expression levels of (A) miR-223-3p, (B) IL-6, (C) E-selectin, and (D) ICAM-1, respectively, in Pyrexia control, acute KD, and subacute KD. This figure represents the relative expression of (E) miR-223-3p, (F) IL-6, (G) E-selectin, and (H) ICAM-1 in coronary lesions group and non-coronary lesions group of KD. **P < 0.01 and ***P < 0.001.

