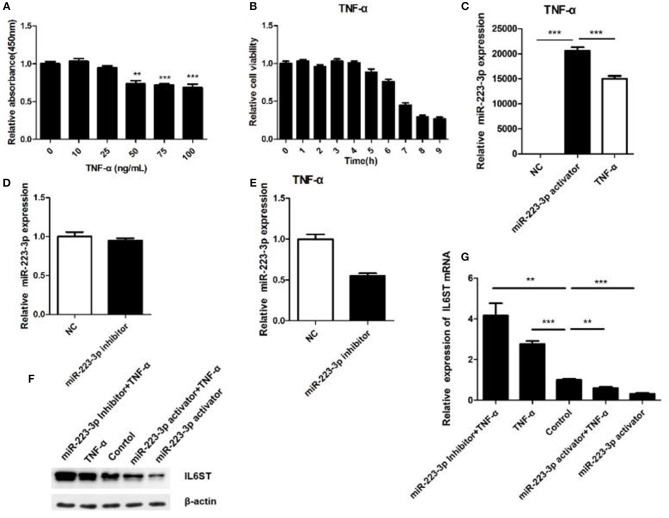
Figure 5.
Relationship between miR-223-3p and IL-6ST in TNF-α treatment. (A) Effect of different concentrations of TNF-α on the viability of HCAECs detected by the MTT assay. (B) The effect of TNF-α (concentration) on cell viability calculated for HCAECs with different time periods of exposure. The relative expression level of miR-223-3p post treatment with miR-223-3p and miR-223-3p activator combined with TNF-α. (D) miR-223-3p inhibitor. (E) miR-223-3p inhibitor and TNF-α. (F) The western blot indicates that the level of expression IL-6ST was least when treated with miR-223-3p and maximum when treated with the inhibitor in the presence of TNF-α. (G) Relative expression analysis of IL-6ST mRNA expression. *P < 0.05, **P < 0.01, and ***P < 0.001.

