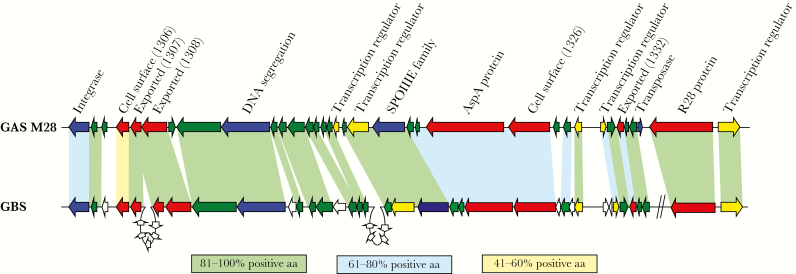
Figure 1.
Comparison of region of difference 2 (RD2) from serotype M28 group A Streptococcus (GAS) to genes present in group B Streptococcus (GBS). Genes are represented by block arrows and are color coded on the basis of their putative open reading frame function or the type of protein they encode (blue, mobility; yellow, gene regulators; red, extracellular proteins; and green, hypothetical). Genes unique to GBS are colored white. Shading between GAS and GBS genes is based on homology at the protein level. Percentages of shared amino acid were calculated by adding the percentages of identical and strongly similar amino acids together for each of the compared protein pairs. The 2 diagonal lines on the GBS part of the figure signify that the 2 genes are not contiguous with the other genes in GBS but are contiguous with the other genes in GAS.

