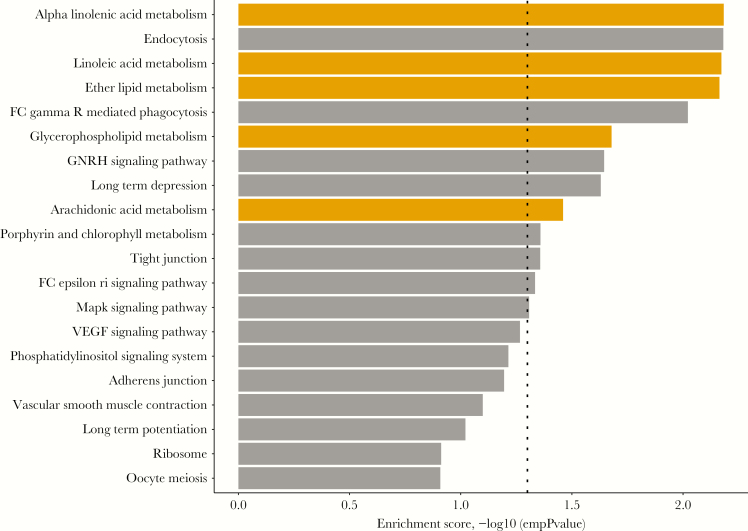
Figure 3.
The pathway enrichment analysis of genes from candidemia loci (P < 9.99 × 10⁻⁴) showed a significant enrichment in alpha-linolenic acid (P = .006), lipid (P = .006), and arachidonic acid metabolism (P = .03). KEGG was used as a database resource of the molecular pathways. The empirical P values are presented, and the dashed black line corresponds to a P threshold of significance .05.

