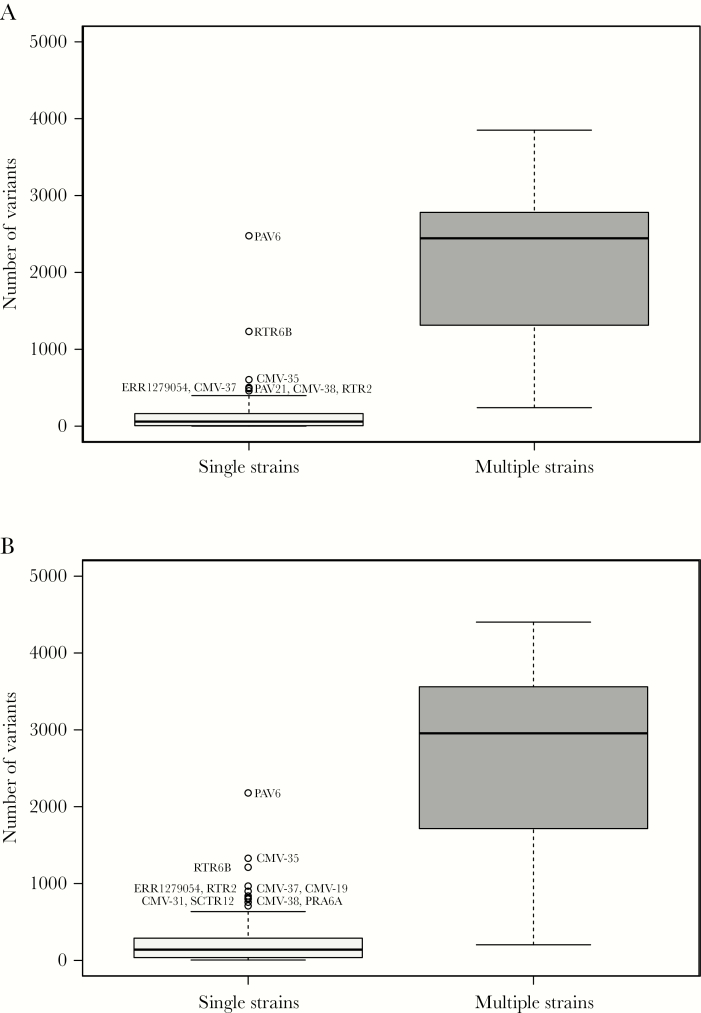
Figure 2.
Box-and-whisker graphs created using ggplot2 (https://ggplot2.tidyverse.org) showing the total number of single-nucleotide polymorphisms (SNPs) detected at a frequency of >2% in single-strain and multiple-strain infections using LoFreq (A) and V-Phaser (B). Single-strain (n = 134 and 131, respectively) and multiple-strain datasets (n = 29 and 29, respectively) for which consensus genome sequences had been derived were identified by motif read-matching, and the total number of SNPs in each dataset was enumerated (insertions, deletions, and length polymorphisms were not considered). LoFreq employed a minimal coverage depth of 10 reads (minimal SNP quality [phred] 64) and strand-bias significance with a false discovery rate correction of P < .001. V-Phaser employed phasing with a window size of 500 nucleotides and quality score (phred) 20 for calibrating the significance of strand-bias at P < .05. Each box (light gray for single strains and dark gray for multiple strains) encompasses the first to third quartiles (Q1–Q3) and shows the median as a thick line. For each box, the horizontal line at the end of the upper dashed whisker marks the upper extreme (defined as the smaller of Q3 + 1.5 [Q3–Q1] and the highest single value), and the horizontal line at the end of the lower dashed whisker marks indicates the lower extreme (the greater of Q1 – 1.5 [Q3–Q1] and the lowest single value).

