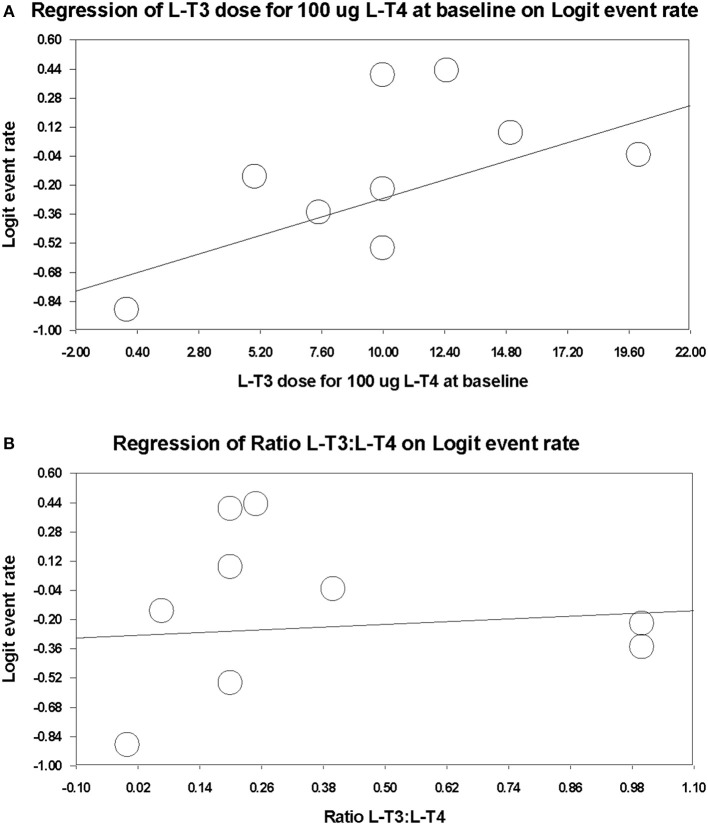
Figure 3.
Meta-regression plots examining for any dose-response relationship between combination therapy dose and treatment preference over L-T4 monotherapy (L-T4 monotherapy during or before trial). (A) Total daily L-T3 dosage (ug) on combination therapy. (B) Ratio of L-T3 divided by L-T4 dosage (ug) on combination therapy.

