Figure 3.
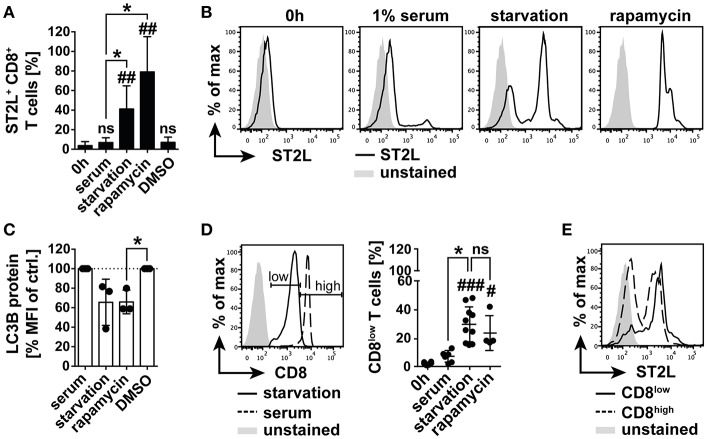
Nutrient deprivation mediates emergence of ST2L+ CD8low T cells. (A) Expression of ST2L was determined on CD8+ T cells after isolation, upon 20 h cultivation with 1% human serum or under serum deprived conditions (starvation). Inhibition of mTOR was achieved by treatment with rapamycin in serum with DMSO in serum as control (DMSO). (B) Exemplary histograms of CD8+ T cells after isolation (0 h) or cultured with different conditions for 20 h. (C) Turnover of intracellular autophagy marker LC3B was assessed by flow cytometry in the respective treated CD8+ T cells. (D) Exemplary histograms showing the gating strategy for discrimination of CD8high T cells and CD8low T cells emerging upon serum deprivation. Percentage of CD8low of total CD8+ T cells was assessed by flow cytometry. (E) Representative Data for ST2L expression on CD8low and CD8high. Data are shown as mean ± SD of (A,D) 0 h n = 6, starvation n = 10, serum n = 7, rapamycin n = 4, DMSO n = 4 or (C) n = 3 per treatment from different donors and at least n = 3 independently performed experiments. *p ≤ 0.05, ##p < 0.01,###p < 0.001, and p < 0.0001 using Kruskal–Wallis test with Dunn's post-test for (A,D) or one-sample t-test for (C). #for comparisons to the 0 h time point, *for comparisons as indicated.

