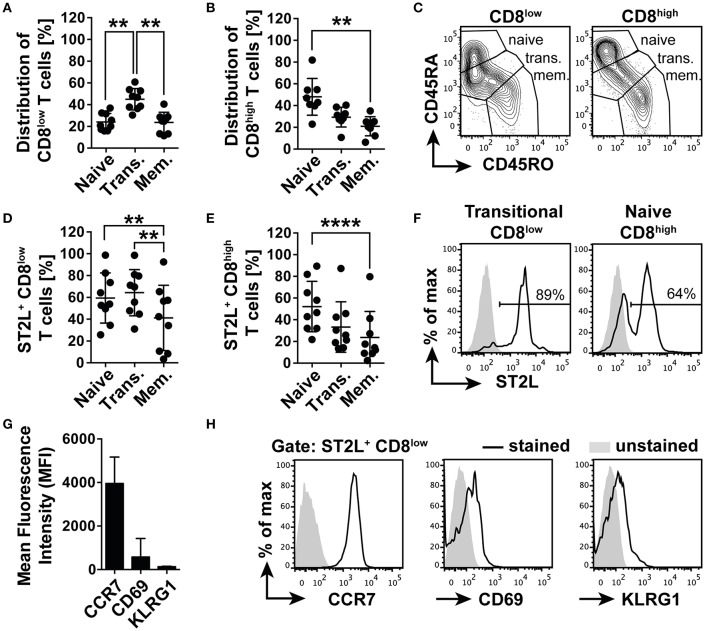
Figure 4.
ST2L+ CD8low T cells are transitional CCR7+ T cells. Distribution of naïve (CD45RA+RO−), transitional (Trans., CD45RA+RO+) and memory type (Mem., CD45RA−RO+) subpopulations of (A) CD8low and (B) CD8high T cells determined by flow cytometry. (C) Representative data for gating strategy of naïve, transitional, and memory type CD8low and CD8high. Percentage of ST2L expressing naïve, transitional, or memory type (D) CD8low, and (E) CD8high. (F) Representative histograms of ST2L expression of transitional CD8low and naïve CD8high. (G) Mean fluorescence intensity of ST2L+ CD8low expressing CCR7, CD69, and KLRG1 and (H) representative flow cytometry data. Data are shown as mean ± SD of (A–F) n = 9 or (G,H) n = 5 of different donors with at least n = 3 independently performed experiments. **p < 0.01, ****p < 0.0001 using (A,B) Kruskal–Wallis test with Dunn's post-test or (D,E) Friedman test with Dunn's post-test.

