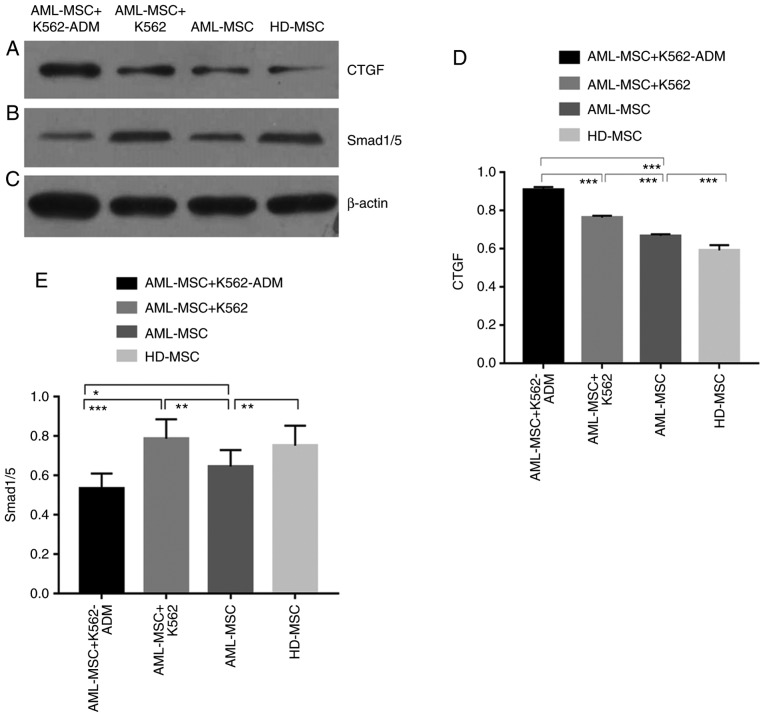
Figure 7.
Western blot analysis detection and analysis. (A) Western blot demonstrating CTGF protein expression. (B) Western blot demonstrating phosphorylated smad1/5 protein expression. (C) Western blot demonstrating β-actin protein expression. (D) CTGF protein expression was significantly increased in the co-culture group compared with the culture group alone. The expression of AML-MSCs was higher than that of HD-MSCs (***P<0.001). (E) The expression of phosphorylated protein smad1/5 was significantly increased in the K562 co-culture group, and significantly decreased in the K562-ADM co-culture group. The expression of AML-MSCs was lower than that of the HD-MSCs group (*P<0.05, **P<0.01 and ***P<0.001). AML-MSCs, acute myeloid leukemia derived-mesenchymal stem cells; HD-MSCs, healthy donor derived-mesenchymal stem cells.

