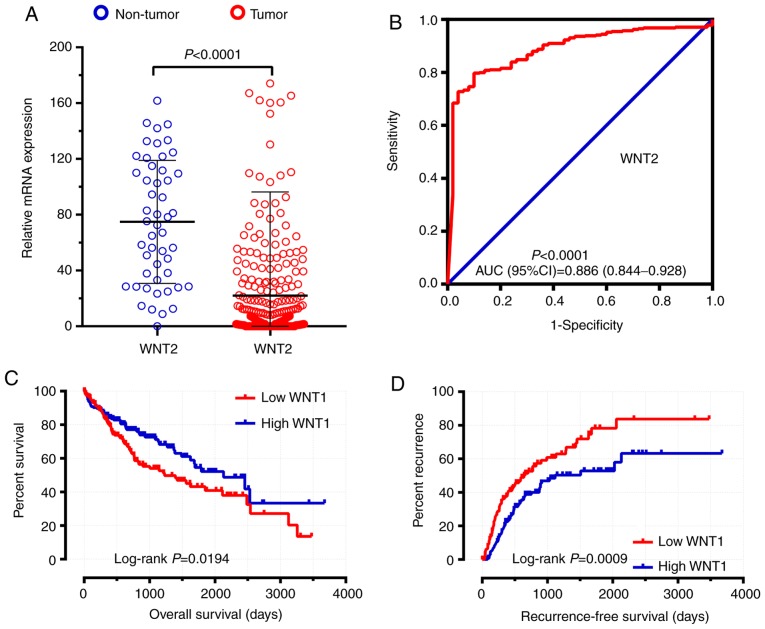
Figure 11.
Diagnostic and prognostic values of WNT genes in TCGA validation cohort. (A) the relative expression of WNT2 in HCC tumor tissues and non-tumor tissues; (B) ROC curves of WNT2; (C) Kaplan-Meier survival curves of WNT1 for OS; (D) Kaplan-Meier survival curves of WNT1 for RFS. TCGA, The Cancer Genome Atlas; HCC, hepatocellular carcinoma; ROC, receiver operating characteristics; AUC, area under the ROC curve; OS, overall survival; RFS, recurrence-free survival.

