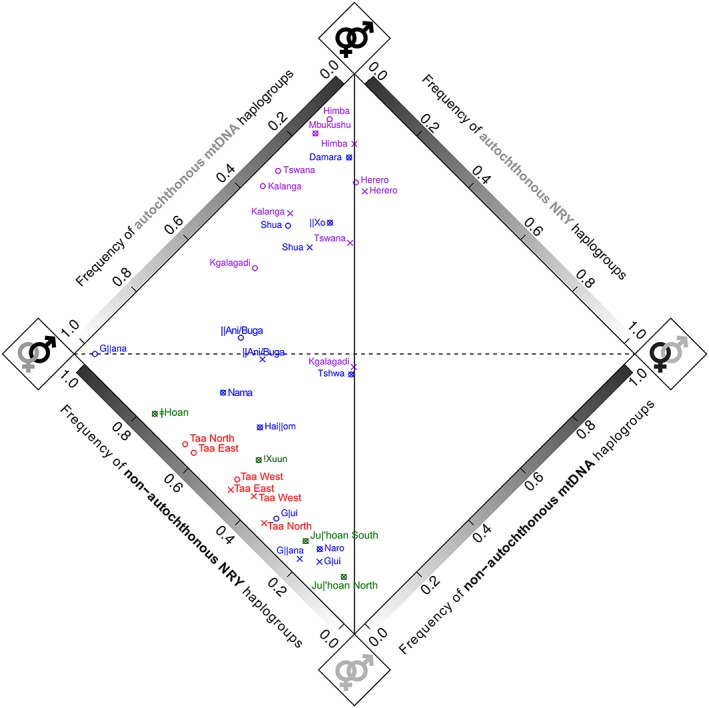
Figure 4.

Diamond plot showing dominant uniparental ancestry components based on mtDNA and NRY haplogroup frequencies. Haplogroups of Eurasian origin are included here as non‐autochthonous haplogroups, to depict all contributions of non‐autochthonous origin to each population, but are removed from calculations of the intensity of sex‐biased gene flow (see text for further details). Language family affiliation is indicated by the color of the population name (green, Kx'a; red, Tuu; blue, Khoe‐Kwadi; purple, Bantu). The horizontal dotted black line separates populations with predominantly autochthonous haplogroups (below the line) from populations with predominantly non‐autochthonous haplogroups (above the line), based on both mtDNA and NRY haplogroup composition. The vertical black line represents equal proportions of non‐autochthonous mtDNA and NRY haplogroups (and hence no sex bias), while the distance from this line reflects the intensity of sex‐biased gene flow. The B2a haplogroup was treated separately as either autochthonous (“x”) or as non‐autochthonous (“o”) [Color figure can be viewed at wileyonlinelibrary.com]
