Figure 5.

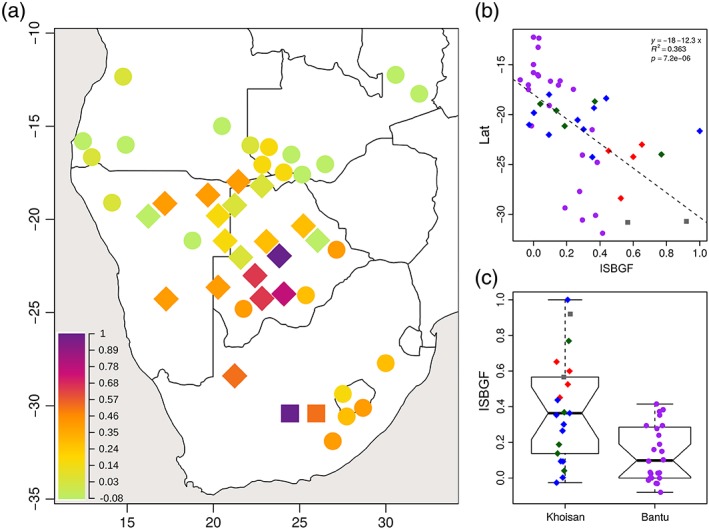
(a) Map of the intensity of sex‐biased gene flow (ISBGF) statistic, treating haplogroup B2a as a non‐autochthonous haplogroup. Dots and diamonds indicate the approximate geographic location of Bantu and Khoisan populations, respectively, and squares indicate the location of the highly admixed Karretjie and Colesberg coloured populations from South Africa. These were treated as Khoisan populations in this analysis as they are likely to be partly descended from Khoisan populations (Traill, 2007; Schlebusch et al., 2011). The color indicates the ISBGF value: Values close to zero indicate equal proportions of autochthonous uniparental markers in a given population; positive values indicate a higher proportion of autochthonous mtDNA haplogroups than autochthonous Y‐chromosome haplogroups, and thus male‐biased gene flow from non‐autochthonous populations to autochthonous populations and female‐biased gene flow from autochthonous populations to non‐autochthonous populations; negative values (observed only in the Herero) indicate the opposite. (b) Correlation between latitude and ISBGF. (c) Differences in ISBGF between Khoisan and Bantu populations (Wilcoxon rank sum test with continuity correction indicates significant differences in the ISBGF means between Khoisan and Bantu populations: W = 387, FDR‐corrected p value = 0.003, 95% CI = 0.075–0.377). Different Khoisan language families are represented with different colors as in Figure 1 (with the Karretjie and Colesberg coloured populations from South Africa colored in gray) [Color figure can be viewed at wileyonlinelibrary.com]
