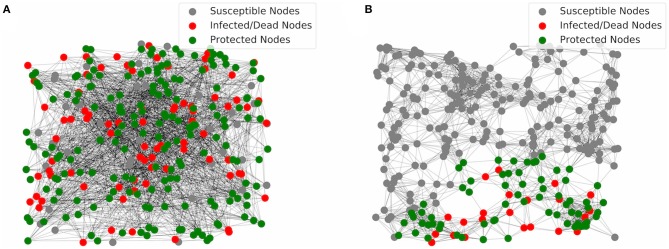
Figure 3.
Visualization of simulations of the multiplex networks. (A) In the network with two ER graphs, most of the nodes are either infected and then dead (red) or protected (green) at the end of infection. (B) In the network with two GR graphs, most of the nodes are susceptible (gray) at the end of infection. Protection of host cells by the IFN signaling leads to an outer layer of protected cells that contain the infection at the local area of the initial infected nodes, i.e., the initial site of viral entry.

