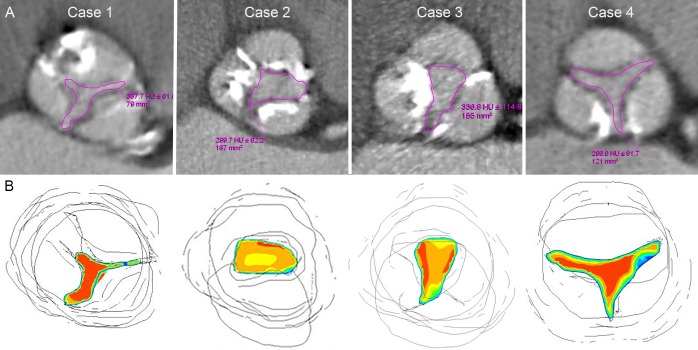
Figure 3.
Cases demonstrating the correlation of CT aortic valve area (CT-AVA) with computational flow dynamics. All cases have echocardiographic Vmax>4 m/s and mean gradient>40 mm Hg. (A) Upper row demonstrates CT-AVA by direct planimetry, while lower row (B) depicts computational fluid dynamics simulation (red colour representing highest velocity, blue intermediate and yellow lowest). Case 1 represents consistent aortic stenosis grading with CT-AVA=0.8 cm2, flow rate=517 and flat velocity profile of 1.1. Cases 2, 3 and 4 represent inconsistent grading with CT-AVA=1.7 cm2, 1.5 cm2 and 1.2 cm2; high flow rate of 604, 701 and 530; and skewed velocity profile of 1.3, 1.24 and 1.3, respectively.

