
Figure 3.
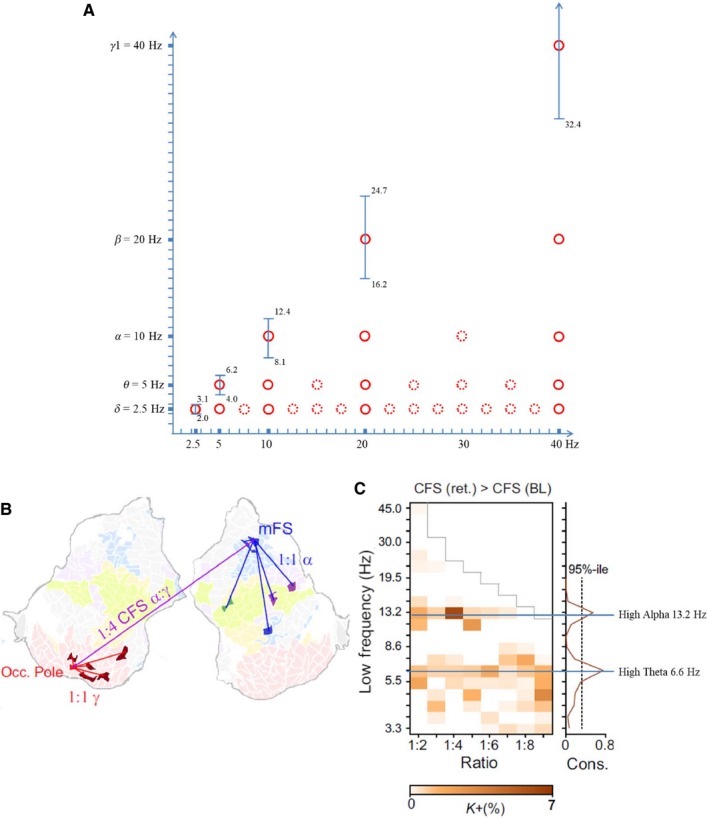
The oscillatory hierarchy is shaped by the properties of between‐frequency phase coupling. (A) Illustration of the suggested binary hierarchy. Center frequencies of traditional EEG frequencies (y‐axis; frequency bands, predicted by the ‘golden mean rule’ are shown as vertical bars) exhibit a 1 : 2 frequency relationship between neighboring center frequencies (solid red circles). They also couple with other frequencies at any integer (harmonic) ratios (dotted red circles). Each circle (representing phase coupling between harmonic frequencies) is hypothesized to reflect a specific brain network. This hypothesis is well substantiated by results, reported in Siebenhühner et al. (2016), who analyzed combined EEG–MEG signals, recorded during the retention period of a visual WM task. The example shown in (B) (from Siebenhühner et al., 2016; Fig. 2; reprinted with permission) exhibits three brain networks, an alpha 1 : 1, a gamma 1 : 1, and an alpha : gamma 1 : 4 network that connects the alpha and gamma networks, which are localized in the right medial frontal sulcus (MFS) and left occipital pole respectively. The example in (C) shows the increase in inter‐areal cross‐frequency phase connections during retention relative to baseline (Fig. 3 of Siebenhühner et al. 2016; reprinted with permission). Note the 1 : 2 ratio between high theta at 6.6 Hz and high alpha at 13.2 Hz (the inscriptions in C are made by the author and are not included in the original Fig. 3). Because theta and alpha are 1 : 2 related and because each of the two frequencies shows coupling with higher harmonic frequencies, a binary hierarchy with 6.6, 13.2, 26.4, and 52.8 Hz can be observed.