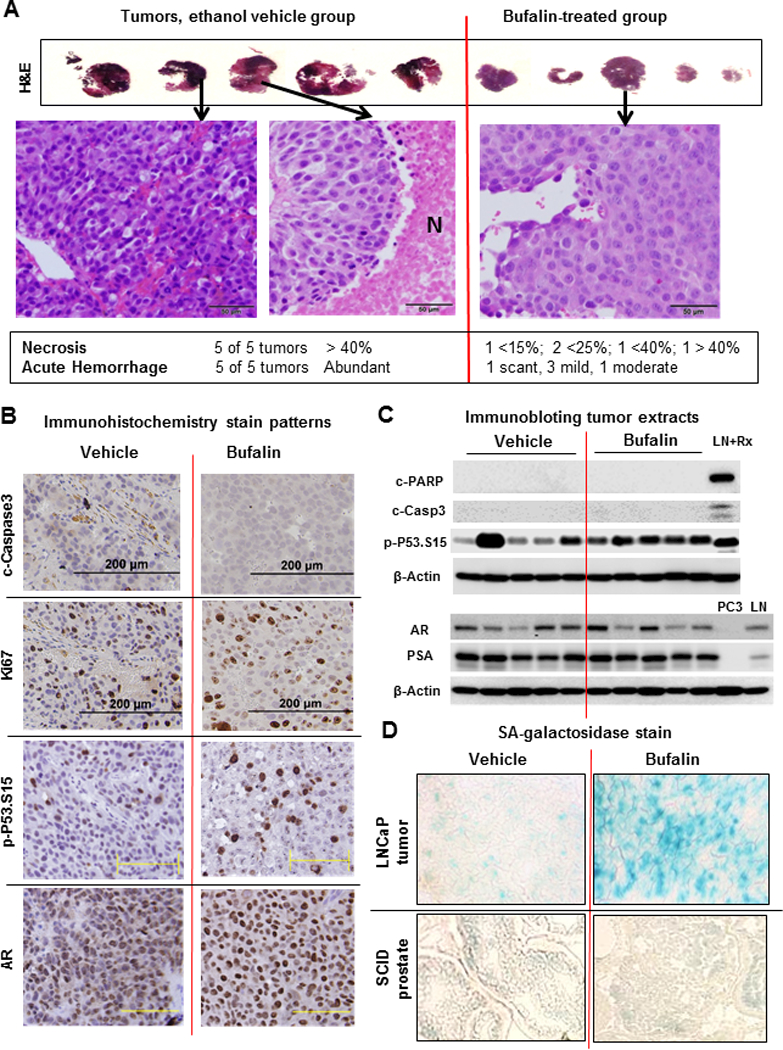
Figure 5. Biomarkers analyses of bufalin-treated LNCaP xenograft tumors.

A, H&E-stained 3rd-8th ranked LNCaP xenograft tumors from ethanol vehicle- and bufalin-treated groups, respectively. Large eosinophilic areas without nuclei in vehicle group represent necrotic regions (marked N in middle panel). Scale bars, 50 micron. B, Representative IHC images of Ki-67 proliferation marker and apoptosis marker (c-caspase 3), p-P53.Ser15 and AR in tumors from vehicle- or bufalin-treated mice. Black scale bars, 200 micron; Yellow scale bars, 100 micron. C, Western blot detection of cleaved-PARP, cleaved-caspase-3, p-P53.Ser15, AR and PSA in tumors from vehicle- or bufalin-treated mice. LNCaP cells exposed to 1 μM doxorubicin (a DNA damage drug) treatment for 24 h were used as a positive control for apoptosis (LN+Rx). PC3 extract and LNCaP extract (LN) were used as negative and positive control for AR and PSA, respectively. D, Representative images of SA-β-gal staining of cryo-sections of LNCaP xenograft tumors and the normal prostate of NSG SCID mice treated with vehicle or bufalin.
