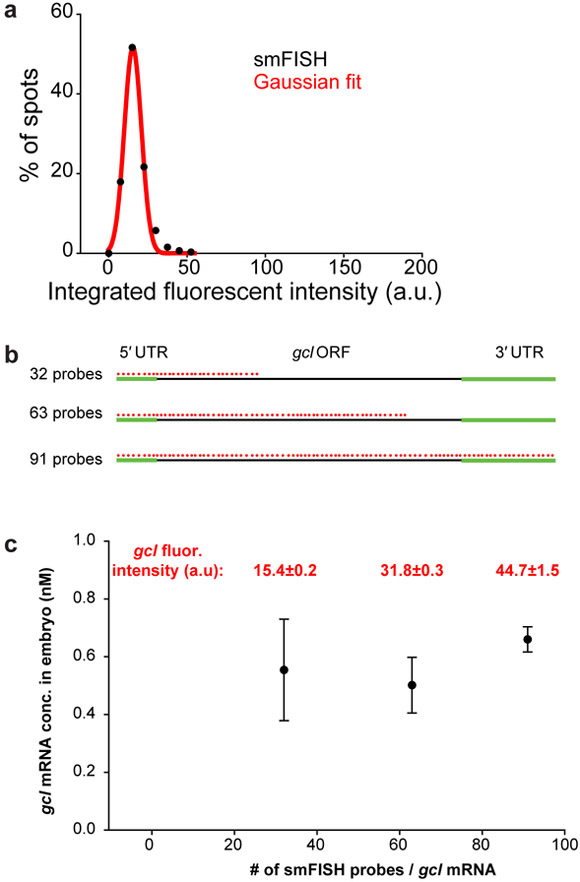
Figure 4. Determining the fluorescent intensity of a single mRNA molecule.
(a) To determine the average integrated fluorescent intensity of a single smFISH-labeled gcl mRNA detected in Fig. 3 g and h, the integrated fluorescence intensities of all detected spots in h are plotted as a histogram (black circles) and fitted to a Gaussian curve (red line). The peak of the Gaussian fit determines the average integrated fluorescence intensity of a single gcl mRNA, here hybridized with 32 singly-labeled Quasar 670 probes, which, with given imaging and microscope parameters was 15.4 ± 0.2a.u. (R2=0.99). (b,c) Adding more smFISH probes to the probe mix increases the integrated fluorescence intensity of a single mRNA but does not change the number of detected gcl mRNAs significantly. gcl was labeled with 32 (gcl 1st third probe mix), 63 (gcl 1st third and 2nd third smFISH probe mix) or 91 (gcl 1st third, 2nd third and 3rd smFISH probe mix) Quasar 670 smFISH probes (b) and an average integrated fluorescent intensity of a single gcl mRNA determined ventrally in the early embryo for each probe mix, as described above. The average integrated fluorescence intensity of a single gcl mRNA, hybridized with 32 singly-labeled Quasar 670 probes was 15.4 ± 0.2 a.u. (R2=0.99) (see Fig. 3), with 63 singly-labeled Quasar 670 probes was 31.8 ± 0.3 a.u. (R2=0.99) and with 91 singly-labeled Quasar 670 probes was 44.7 ± 1.5 a.u. (R2=0.99) (gcl fluorescent intensity reported in red above the graph). (c) Thus, integrated fluorescent intensity of a labeled mRNA scales linearly with the number of smFISH probes hybridizing to the mRNA, yet the number of detected gcl mRNAs, reported as nM concentration of gcl mRNA per embryo, does not change.

