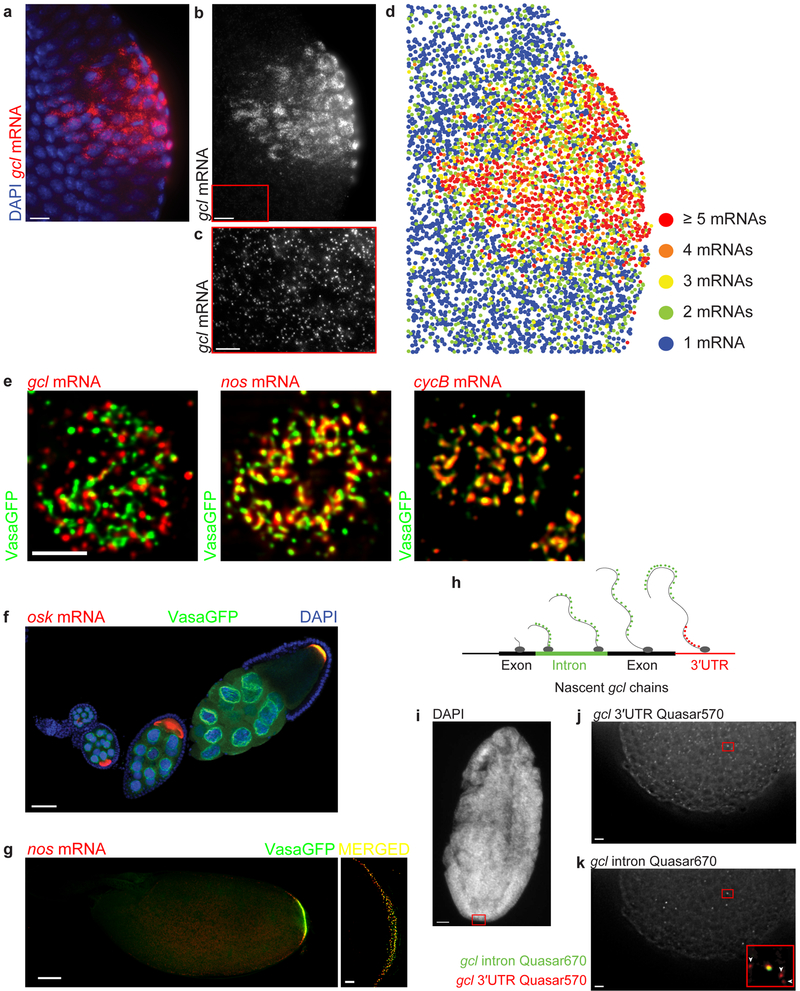
Figure 5. smFISH enables spatial and quantitative characterization of gene expression in the fly tissue.
(a-c) Images of gcl (red) localized at the posterior pole of an embryo forming crescents surrounding the nuclei (labeled with DAPI, blue) of the newly formed primordial germ cells during the 13th nuclear cycle of the embryonic development. The inset marked with a red box in b highlights un-localized, somatic gcl mRNA, further magnified and contrast adjusted in c. (d) Heat map of gcl mRNA demonstrates that outside of the posterior pole, the majority of gcl transcripts are found as single mRNAs. Only approximately 3% of maternally-deposited gcl mRNA is localized to germ granules found at posterior pole of an embryo5 (Fig. 2c, 5e) where it groups within a diffraction limited volume and forms homotypic clusters composed of multiple gcl mRNA molecules5. To create a heat map, the average integrated fluorescent intensity of a single gcl was first determined (see Fig. 3, 4a) after which this value was used to calibrate the intensities of clustered gcl spots at the posterior pole. These had higher fluorescent intensities and therefore contained multiple gcl mRNAs in a diffraction-limited volume. During spot detection, Airlocalize determines the position of each single mRNA and mRNA cluster in 2D and 3D with sub-pixel resolution. These coordinates are then used to plot the spatial distribution individual mRNAs and clusters in the embryo. In all panels, three consecutive Z planes (z = 400 nm) were maximally projected and subsequently analyzed. All images were acquired with a widefield microscope in 3D and subsequently deconvolved using Huygens. (e) iSIM super-resolution imaging reveals a detailed spatial organization of mRNA-bound germ granules. Germ granule-localized gcl, nos and cycB mRNAs group to form homotypic mRNA clusters that inhabit different positions within germ granules. gcl clusters are located at the germ granule periphery while cycB clusters are located in the center of the granule. nos mRNA clusters are located midway between gcl and cycB clusters. Shown are images of granules found in the 10th nuclear cycle of early embryonic development. Images were acquired in 3D and afterwards deconvolved using Huygens. (f,g) Images demonstrating accumulation of oskar (osk) and nanos (nos) mRNA (red), respectively at the posterior pole of a developing oocyte through oogenesis. During late oogenesis, Oskar protein recruits Vasa protein (green) to the posterior pole to form germ plasm. Germ plasm was visualized with a Vasa transgene, tagged with a green fluorescent protein (GFP)5. First 10 oogenic stages are shown in f. In g, an oocyte found in late oogenic stage 14 is shown. Nuclei in f were stained with the DAPI stain (blue). Images in f and g (left panel in g) were acquired with a laser scanning confocal microscope. An image of the germ plasm shown under “MERGED” was acquired with an iSIM. (h-k) Intronic smFISH probes reveal active sites of transcription and discriminate between spliced mature transcripts and unspliced nascent transcripts. (h) A schematic depicting detection of gcl mRNA transcription site using smFISH probes hybridizing to either gcl introns (green dots) or gcl 3′UTR (red dots). (i) An image of a DAPI stained embryo to visualize nuclei. (j,k) Before being spliced, smFISH-hybridized introns (green) co-localize with the smFISH probes hybridizing to gcl 3′UTR (red) at the site of transcription (inset in k, yellow spot). Mature gcl mRNAs do not bind intronic probes (inset in k, arrowheads). Scale bar in e is 2.5 µm, in c, g (right panel under merged) j and k is 5 µm, 10 µm in a and b and 50 µm in f, g (left panel) and h.

