Figure 1.
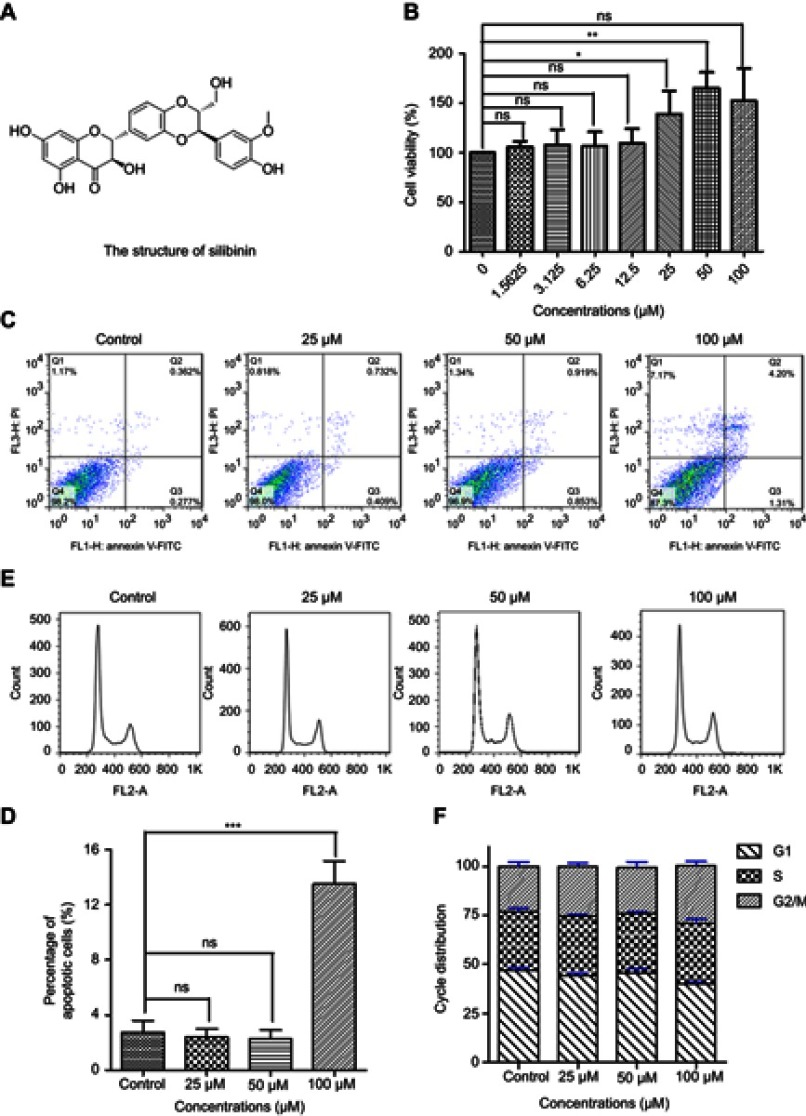
Silibinin has no side effects for hepatic cells. (A) Schematic drawing of silibinin. (B) The LO2 cells were treated with silibinin at indicated concentrations for 48 h, and then the cell viability was determined by MTT assay. The results were shown as the percentage of cell viability in control group. (C) 25, 50 or 100 μM silibinin treatment induces apoptosis of LO2 cells. Apoptotic cells were assayed by Annexin V/PI staining and FACS analysis. (D) Quantification of (C). E, FACS analysis of cell cycle arrest in control and silibinin LO2 cells. Cells were treated with 25, 50 or 100 μM of silibinin for 48 h before the assay. (F) Quantification of (E). The Bar chart of all data represents mean ± SD of three independent experiments, *p<0.05, **p<0.01 and ***p<0.001 vs control group.
Abbreviations: MTT, the 3-(4,5-dimethylthiazol-2-yl)-2,5-diphenyltetrazolium bromide assay; FACS, flow cytometry; ns, non-significant.

